
Nutrition Facts table formats
On this page
- Considerations for selecting an appropriate Nutrition Facts table
- Steps for choosing a Nutrition Facts table
- Alternate methods of presentation
- Formats for specific packaging cases
- Reference information
Considerations for selecting an appropriate Nutrition Facts table
Although the Food and Drug Regulations (FDR) require the declaration of a Nutrition Facts table (NFt) on most prepackaged products, the information may be presented in a variety of different formats. Industry has considerable flexibility in presentation, and may choose from several different format "families". Within each format family, further choices of presentation style are available. For example, manufacturers may opt for separate French and English tables (including a narrow variation in the case of the standard format) or choose to use a single bilingual table.
The specific format chosen and the size of Nutrition Facts table are based on a combination of mandatory and voluntary considerations.
First consideration: Who will buy the product
There are major differences in the nutrition labelling requirements depending upon who is consuming or buying the product. Basically, for the purposes of nutrition labelling there are 3 classes of foods:
- prepackaged foods for the consumer (including foods for infants 6 months of age or older but less than 1 year of age) and foods that will be repackaged for retail
- prepackaged foods for use in manufacturing other foods, and
- ready-to-serve multiple-serving prepackaged products served in a commercial or industrial enterprise or an institution
The 2 last classes of foods have specific requirements associated with them. The appropriate sections provide further information.
Second consideration: On what basis will the information be presented
In the majority of cases, nutrition information is presented on the basis of a serving of food as sold. However, nutrition information for specific forms of coffee (whole or ground beans and pods) and tea (dry loose leaves, bags and pods) must be provided in the Nutrition Facts table on an "as consumed" basis, rather than on an "as sold" basis. These forms of coffee and tea are not consumed in their "as sold" form. They are percolated, brewed, infused or steeped in water and the original food (grounds or leaves) is then discarded and only the liquid is consumed. Issues related to serving size are discussed in the Information within the Nutrition Facts table page.
However, in certain circumstances, the manufacturer is provided with other presentation options. For example, nutrition information may be provided for a food in more than 1 amount (2 cookies, 1 cookie), or for individual foods in a multi-pack (crackers and cheese). As well, information for the food as sold (such as a cold cereal) may differ from information about the food as prepared (cereal with milk).
Sections B.01.401(6), B.01.401(6.1), B.01.403(5) and B.01.406 of the FDR outline the conditions under which the various options for the presentation of nutrition information may be used. In some cases the manner of presenting information is mandatory, while in other cases it is at the discretion of the manufacturer.
The manner of presenting nutrition information directly affects the choice of Nutrition Facts table format.
Third consideration: What format is required
The steps involved in choosing an NFt format are set out in the section Steps for choosing a Nutrition Facts table.
Steps for choosing a Nutrition Facts table
Step 1: Measure the available display surface of your package
The Nutrition Facts table is not required to occupy more than 15% of the available display surface (ADS) of a package, except in the case of smaller packages.
For information on calculating the ADS of the package, see the Available display surface page. When calculating the space occupied by the Nutrition Facts table, remember the following 3 principles:
- the area occupied by the Nutrition Facts table is based on mandatory information only, that is, the core nutrients and triggered additional information
- when calculating the area occupied by the table, do not consider the space occupied by voluntarily disclosed additional information
- however, do consider the area of both the English and the French tables when separate unilingual tables are used
Certain rules may apply with respect to formats for specific packaging cases:
- if the ADS is less than 100 cm2, refer to the Small packages < 100 cm2 available display surface section
- if the ADS is equal to or greater than 200 cm2, the product is sold only in the retail establishment where it is packaged and the package is labelled with a sticker, please refer to the Retail packages ≥ 200 cm2 available display surface section
Step 2: Choose a Nutrition Facts table format family
Sections B.01.454 to B.01.459 of the FDR set out "families" of formats. Each family provides format options for presenting nutrition information in a specific manner, as mentioned above. For example, the standard/horizontal/linear family provides format options for presenting nutrition information for a single serving of food as sold, while the "Dual format – Foods requiring preparation" family provides options for presenting nutrition information for the food as sold and as prepared.
The table below titled "Which Nutrition Facts table format family should I use" is a tool for selecting the appropriate format family for a prepackaged product. Once the appropriate family is determined, the decision tree diagrams provide guidance on the specific template that should be chosen.
There are similar families of formats for prepackaged foods for infants 6 months of age or older but less than 1 year of age with specific exceptions.
| Format | May be used for | Must be used for | Example(s) |
|---|---|---|---|
| Standard/ horizontal/ linear formats [B.01.454, FDR] |
|
|
|
| Simplified formats [B.01.455, FDR] |
|
not applicable (always optional) |
|
| Simplified formats – single-serving prepackaged products [B.01.455.1, FDR] |
|
not applicable (always optional) |
|
| Dual format – foods requiring preparation [B.01.456, FDR] |
|
not applicable (always optional) |
|
| Aggregate format – different kinds of food [B.01.457, FDR] |
|
|
|
| Dual format – different amounts of food [B.01.458, FDR] |
|
not applicable (always optional) |
|
| Aggregate format – different amounts of food [B.01.459, FDR] |
|
not applicable (always optional) |
|
Step 3: Choose the appropriate Nutrition Facts table using decision trees
- Guide to using decision trees
- Standard, horizontal and linear formats
- Simplified formats
- Simplified formats – single-serving prepackaged products
- Dual format – foods requiring preparation
- Aggregate format – different kinds of foods
- Dual format – different amounts of food
- Aggregate format – different amounts of food
Guide to using decision trees
The decision trees for each family of formats provide a stepwise strategy to determine an appropriate format and version (size) of the Nutrition Facts table. In each decision tree:
- the first level options provide the most desirable alternatives – the largest and most readable formats
- the second and third level options provide decreasingly favourable options with respect to readability and size
The manufacturer must start at the top of the tree and work their way down.
All selections in the first level options must be exhausted before second level options may be considered. Likewise, all second level options must be exhausted before proceeding to any third level options.
At the first level, the manufacturer is provided with the choice of different options, such as separate French and English tables (including a narrow variation in the case of the standard format) or a single bilingual table. For each format variation, a number of different sizes are provided.
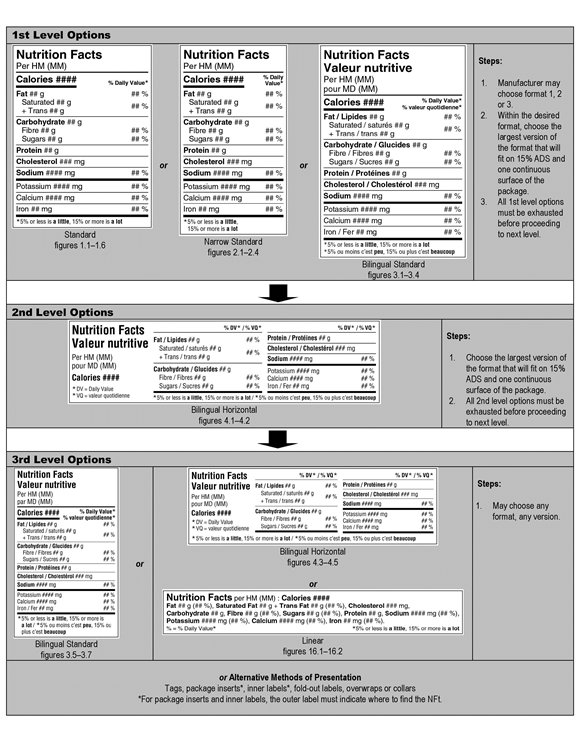
For example, the decision tree for standard/horizontal/linear formats begins by laying out the first level options:
First level options
Standard
Description – Figures 1.1 to 1.6
Left justified at the top of the table is the heading Nutrition Facts in bold. The next line is Per HM open parenthesis MM close parenthesis. There is a rule below Per HM open parenthesis MM close parenthesis that spans the width of the table. The next line is Calories in bold followed by a placeholder, also in bold, for the amount of Calories per serving of the product. Right justified on the same line is the subheading percent symbol Daily Value in bold. Percent Daily Value has an asterisk that refers to a footnote at the bottom of the Nutrition Facts table. There is a thick rule under Calories that ends after the amount placeholder; it does not span the width of the table.
Left justified on the next line is Fat in bold followed by a placeholder for amount of fat followed by a lowercase g. Right justified on the same line is a placeholder for the percent Daily Value of fat followed by a percent symbol. Indented on the next line under Fat is Saturated and a placeholder for the amount of saturated fat followed by a lowercase g. Indented on the next line under Saturated there is a plus symbol followed by Trans followed by a placeholder for the amount of trans followed by a lowercase g. There is a placeholder for the combined percent Daily Value for saturated and trans fat which is right justified and vertically centered against the saturated and trans information on the left. It is followed by a percent symbol. There is a thin rule below the Trans information that spans the width of the table.
The next line is Carbohydrate in bold followed by a placeholder for the amount of carbohydrate followed by a lowercase g. Indented on the next line under Carbohydrate is Fibre followed by a placeholder for the amount of fibre followed by a lowercase g. Right justified on the same line is a placeholder for percent Daily Value of Fibre followed by a percent symbol. Indented on the next line under Fibre is Sugars followed by a placeholder for the amount of sugars followed by a lowercase g. Right justified on the same line is a placeholder for the percent Daily Value of sugars followed by a percent symbol. There is a thin rule under the sugars information that spans the width of the table.
The next line is Protein in bold followed by a placeholder for amount of protein followed by a lowercase g. There is a thin rule under the protein information that spans the width of the table.
The next line is Cholesterol in bold followed by a placeholder for the amount of cholesterol followed by mg in lowercase. There is a thin rule under the cholesterol information that spans the width of the table.
The next line is Sodium in bold followed by a placeholder for the amount followed by mg in lowercase. Right justified on the same line is a placeholder for the percent Daily Value of sodium followed by a percent symbol. There is a thick rule under the sodium information that spans the width of the table.
The next line is Potassium followed by a placeholder for the amount of potassium followed by mg in lowercase. Right justified on the same line is a placeholder for percent Daily Value of potassium followed by a percent symbol. There is a thin rule under the potassium information that spans the width of the table.
The next line is Calcium followed by a placeholder for the amount of calcium followed by mg in lowercase. Right justified on the same line is a placeholder for the percent Daily Value of calcium followed by a percent symbol. There is a thin rule below the calcium information that spans the width of the table.
The next line is Iron followed by a placeholder for the amount of iron followed by mg in lowercase. Right justified on the same line is a placeholder for the percent Daily Value of iron followed by a percent symbol. There is a thick rule under the iron information that spans the width of the Nutrition Facts table.
The next line is the percent Daily Value footnote that was referred to at the beginning of the table description. The footnote starts with an asterisk followed by the statement: 5 percent symbol or less is a little, 15 percent symbol or more is a lot. The terms a little and a lot are in bold. This is the end of the Nutrition Facts table.
or
Narrow standard
Description – Figures 2.1 to 2.4
Left justified at the top of the table is the heading Nutrition Facts in bold. The next line is Per HM open parenthesis MM close parenthesis. There is a rule below Per HM open parenthesis MM close parenthesis that spans the width of the table. The next line is Calories in bold followed by a placeholder, also in bold, for the amount of Calories per serving of the product. Right justified on the same line is the subheading percent symbol Daily Value in bold. Percent symbol Daily is on top of Value. Percent Daily Value has an asterisk that refers to a footnote at the bottom of the Nutrition Facts table. There is a thick rule under Calories that ends after the amount placeholder; it does not span the width of the table.
Left justified on the next line is Fat in bold followed by a placeholder for amount of fat followed by a lowercase g. Right justified on the same line is a placeholder for the percent Daily Value of fat followed by a percent symbol. Indented on the next line under Fat is Saturated and a placeholder for the amount of saturated fat followed by a lowercase g. Indented on the next line there is a plus symbol followed by Trans followed by a placeholder for the amount of trans followed by a lowercase g. There is a placeholder for the combined percent Daily Value for saturated and trans fat which is right justified and vertically centered against saturated and trans information on the left. It is followed by a percent symbol. There is a thin rule below the Trans information that spans the width of the table.
The next line is Carbohydrate in bold followed by a placeholder for the amount of carbohydrate followed by a lowercase g. Indented on the next line under Carbohydrate is Fibre followed by a placeholder for the amount of fibre followed by a lowercase g. Right justified on the same line is a placeholder for percent Daily Value of Fibre followed by a percent symbol. Indented on the next line under Fibre is Sugars followed by a placeholder for the amount of sugars followed by a lowercase g. Right justified on the same line is a placeholder for the percent Daily Value of sugars followed by a percent symbol. There is a thin rule under the sugars information that spans the width of the table.
The next line is Protein in bold followed by a placeholder for amount of protein followed by a lowercase g. There is a thin rule under the protein information that spans the width of the table.
The next line is Cholesterol in bold followed by a placeholder for the amount of cholesterol followed by mg in lowercase. There is a thin rule under the cholesterol information that spans the width of the table.
The next line is Sodium in bold followed by a placeholder for the amount followed by mg in lowercase. Right justified on the same line is a placeholder for the percent Daily Value of sodium followed by a percent symbol. There is a thick rule under the sodium information that spans the width of the table.
The next line is Potassium followed by a placeholder for the amount of potassium followed by mg in lowercase. Right justified on the same line is a placeholder for percent Daily Value of potassium followed by a percent symbol. There is a thin rule under the potassium information that spans the width of the table.
The next line is Calcium followed by a placeholder for the amount of calcium followed by mg in lowercase. Right justified on the same line is a placeholder for the percent Daily Value of calcium followed by a percent symbol. There is a thin rule below the calcium information that spans the width of the table.
The next line is Iron followed by a placeholder for the amount of iron followed by mg in lowercase. Right justified on the same line is a placeholder for the percent Daily Value of iron followed by a percent symbol. There is a thick rule under the iron information that spans the width of the Nutrition Facts table.
The next line is the percent Daily Value footnote that was referred to at the beginning of the table description. The footnote starts with an asterisk followed by the statement: 5 percent symbol or less is a little, with 'a little' in bold. The next line is 15 percent symbol or more is a lot with 'a lot' in bold. This is the end of the Nutrition Facts table.
or
Bilingual standard
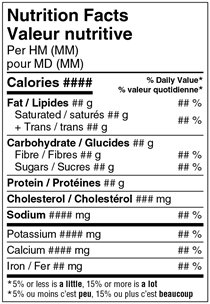
Description – Figures 3.1 to 3.4
Left justified at the top of the table is the heading Nutrition Facts and stacked below it is the heading Valeur nutritive. Both are in bold. The next line is Per HM open parenthesis MM close parenthesis. The next line is pour MD open parenthesis MM close parenthesis. There is a thin rule below pour MD open parenthesis MM close parenthesis that spans the width of the table. The next line is Calories in bold followed by a placeholder, also in bold, for the amount of Calories per serving of the product. Right justified on the same line is the subheading percent symbol Daily Value in bold. Stacked under this is percent symbol valeur quotidienne. Both Percent Daily Value and percent valeur quotidienne are followed by an asterisk that refers to a footnote at the bottom of the Nutrition Facts table. There is a thick rule under Calories that ends after the amount placeholder; it does not span the width of the table.
Left justified on the next line is Fat, forward slash, Lipides in bold followed by a placeholder for amount of fat followed by a lowercase g. Right justified on the same line is a placeholder for percent Daily Value of fat followed by a percent symbol. Indented on the next line under Fat, forward slash, Lipides is Saturated, forward slash, saturés and a placeholder for the amount of saturated fat, followed by a lower case g. Indented on the next line is a plus symbol followed by Trans, forward slash, trans followed by a placeholder for the amount of trans fat, followed by lowercase g. There is a placeholder for the combined percent Daily Value for saturated and trans fat which is right justified and vertically centered against the saturated and trans information on the left. There is a thin rule below the trans information that spans the width of the table.
The next line is Carbohydrate, forward slash, Glucides in bold followed by a placeholder for the amount of carbohydrate followed by a lowercase g. Indented on the next line under Carbohydrate, forward slash, Glucides is Fibre, forward slash, Fibres, followed by a placeholder for the amount of fibre followed by a lowercase g. Right justified on the same line is a placeholder for percent Daily Value of Fibre followed by a percent symbol. Indented on the next line under Fibre is Sugars, forward slash, Sucres, followed by a placeholder for the amount of sugars followed by a lowercase g. Right justified on the same line is a placeholder for the percent Daily Value of sugars followed by a percent symbol. There is a thin rule under the sugars information that spans the width of the table.
The next line is Protein, forward slash, Protéines in bold followed by a placeholder for amount of protein followed by a lowercase g. There is a thin rule under the protein information that spans the width of the table.
The next line is Cholesterol, forward slash, Cholestérol in bold followed by a placeholder for the amount of cholesterol followed by mg in lowercase. There is a thin rule under the cholesterol information that spans the width of the table.
The next line is Sodium in bold followed by a placeholder for the amount followed by mg in lowercase. Right justified on the same line is a placeholder for the percent Daily Value of sodium followed by a percent symbol. There is a thick rule under the sodium information that spans the width of the table.
The next line is Potassium followed by a placeholder for the amount of potassium followed by mg in lowercase. Right justified on the same line is a placeholder for percent Daily Value of potassium followed by a percent symbol. There is a thin rule under the potassium information that spans the width of the table.
The next line is Calcium followed by a placeholder for the amount of calcium followed by mg in lowercase. Right justified on the same line is a placeholder for the percent Daily Value of calcium followed by a percent symbol. There is a thin rule below the calcium information that spans the width of the table.
The next line is Iron, forward slash, Fer followed by a placeholder for the amount of iron followed by mg in lowercase. Right justified on the same line is a placeholder for the percent Daily Value of iron followed by a percent symbol. There is a thick rule under the iron information that spans the width of the Nutrition Facts table.
The next 2 lines is the percent Daily Value footnote that was referred to at the beginning of the table description. The footnote starts with an asterisk followed by the statement: 5 percent symbol or less is a little, 15 percent symbol or more is a lot and on the second line is an asterisk followed by the statement: 5 percent symbol ou moins c'est peu, 15 percent symbol ou plus c'est beaucoup. The terms 'a little', 'a lot', 'peu', and 'beaucoup' are in bold. This is the end of the Nutrition Facts table.
Once the format variation has been chosen, the largest version of that format must be used unless:
- it requires more than 15% of the available display surface (ADS), the space available on the package to carry labelling information, or
- it does not fit on 1 continuous surface of the package
If this is the case, then the next version should be used unless it also requires more than 15% of the ADS or does not fit on 1 continuous surface, and so on.
The largest version of the chosen format must be selected that meets these criteria.
For example, if the manufacturer chose the standard format (format 1), they must choose the largest Nutrition Facts table variation that fits (figure 1.1 is the largest variation; figure 1.6 is the smallest.)
However, if none of the size variations of format 1 (figures 1.1 to 1.6) will work on the package, then the manufacturer must examine other first level options: the narrow standard format (format 2) and the bilingual standard format (format 3). The manufacturer cannot proceed to the next level in the decision tree until all first level options have been exhausted.
At the lowest level (where packages and Nutrition Facts tables are small), any format variation and any version in the family may be chosen provided that it fits on 1 continuous surface and that the characters printed in the table do not touch each other or the lines (rules).
Notes of explanation
This stepwise approach to choosing a Nutrition Facts table ensures the following basic premises are fulfilled:
- certain formats are more desirable than others because they are more legible. They must always be given first consideration. For example, variations of the standard format (standard, narrow standard, bilingual standard) must always be considered before the bilingual horizontal format
- the largest version of a designated format that will fit within 15% of the ADS and on 1 continuous surface of the package must be chosen before proceeding to a smaller version and all options in 1 level must be exhausted before proceeding to the next level
Standard, horizontal and linear formats [B.01.454, FDR]
Purpose: The standard, horizontal and linear formats present nutrition information for 1 serving of food as sold.
The table Which Nutrition Facts table format family should I use provides guidance on when this format is appropriate for use.
These products usually provide nutrition information for 1 serving of food as sold, using a standard, horizontal or linear format.
Standard, horizontal, linear: hierarchy of formats decision tree
Click on image for larger view
Description – Standard, horizontal, linear: hierarchy of formats decision tree
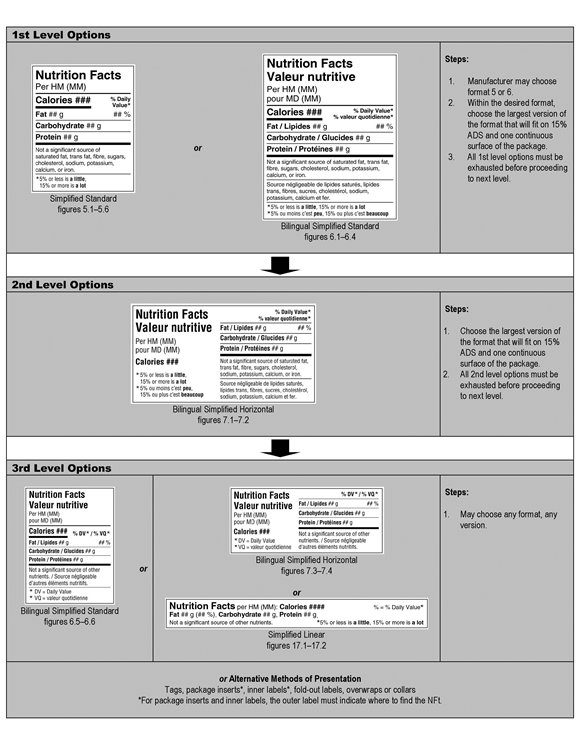
First level options: Steps for choosing between the standard formats
- Manufacturer may choose format 1, 2 or 3. Standard (figures 1.1 to 1.6), narrow standard (figures 2.1 to 2.4) or bilingual standard (figures 3.1 to 3.4).
- Within the desired format, choose the largest version that will fit on 15% ADS and one continuous surface of the package.
- All first level options must be exhausted before proceeding to next level.
Second level options: Steps for choosing between the horizontal formats
- Choose the largest version of format (figures 4.1 to 4.2) that will fit on 15% ADS and one continuous surface of the package.
- All second level options must be exhausted before proceeding to next level.
Third level options: Steps for choosing between the linear formats
- May choose any format, any version: bilingual standard (figures 3.5 to 3.7), bilingual horizontal (figures 4.3 to 4.5), linear (figures 16.1 to 16.2) or alternative methods of presentations such as tags, package inserts, inner labels, fold-out labels, overwraps or collars.
For package inserts and inner labels, the outer label must indicate where to find the NFt.
Major distinguishing features of the standard, horizontal and linear formats
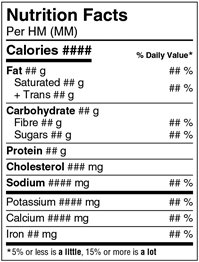
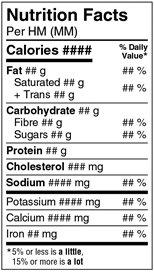
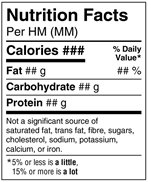
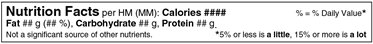
Standard format

Description – Standard format – Figure 1.1
Left justified at the top of the table is the heading Nutrition Facts in bold. The next line is Per HM open parenthesis MM close parenthesis. There is a rule below Per HM open parenthesis MM close parenthesis that spans the width of the table. The next line is Calories in bold followed by a placeholder, also in bold, for the amount of Calories per serving of the product. Right justified on the same line is the subheading percent symbol Daily Value in bold. Percent Daily Value has an asterisk that refers to a footnote at the bottom of the Nutrition Facts table. There is a thick rule under Calories that ends after the amount placeholder; it does not span the width of the table.
Left justified on the next line is Fat in bold followed by a placeholder for amount of fat followed by a lowercase g. Right justified on the same line is a placeholder for the percent Daily Value of fat followed by a percent symbol. Indented on the next line under Fat is Saturated and a placeholder for the amount of saturated fat followed by a lowercase g. Indented on the next line under Saturated there is a plus symbol followed by Trans followed by a placeholder for the amount of trans followed by a lowercase g. There is a placeholder for the combined percent Daily Value for saturated and trans fat which is right justified and vertically centered against the saturated and trans information on the left. It is followed by a percent symbol. There is a thin rule below the Trans information that spans the width of the table.
The next line is Carbohydrate in bold followed by a placeholder for the amount of carbohydrate followed by a lowercase g. Indented on the next line under Carbohydrate is Fibre followed by a placeholder for the amount of fibre followed by a lowercase g. Right justified on the same line is a placeholder for percent Daily Value of Fibre followed by a percent symbol. Indented on the next line under Fibre is Sugars followed by a placeholder for the amount of sugars followed by a lowercase g. Right justified on the same line is a placeholder for the percent Daily Value of sugars followed by a percent symbol. There is a thin rule under the sugars information that spans the width of the table.
The next line is Protein in bold followed by a placeholder for amount of protein followed by a lowercase g. There is a thin rule under the protein information that spans the width of the table.
The next line is Cholesterol in bold followed by a placeholder for the amount of cholesterol followed by mg in lowercase. There is a thin rule under the cholesterol information that spans the width of the table.
The next line is Sodium in bold followed by a placeholder for the amount followed by mg in lowercase. Right justified on the same line is a placeholder for the percent Daily Value of sodium followed by a percent symbol. There is a thick rule under the sodium information that spans the width of the table.
The next line is Potassium followed by a placeholder for the amount of potassium followed by mg in lowercase. Right justified on the same line is a placeholder for percent Daily Value of potassium followed by a percent symbol. There is a thin rule under the potassium information that spans the width of the table.
The next line is Calcium followed by a placeholder for the amount of calcium followed by mg in lowercase. Right justified on the same line is a placeholder for the percent Daily Value of calcium followed by a percent symbol. There is a thin rule below the calcium information that spans the width of the table.
The next line is Iron followed by a placeholder for the amount of iron followed by mg in lowercase. Right justified on the same line is a placeholder for the percent Daily Value of iron followed by a percent symbol. There is a thick rule under the iron information that spans the width of the Nutrition Facts table.
The next line is the percent Daily Value footnote that was referred to at the beginning of the table description. The footnote starts with an asterisk followed by the statement: 5 percent symbol or less is a little, 15 percent symbol or more is a lot. The terms a little and a lot are in bold. This is the end of the Nutrition Facts table.
- Vertical display of nutrition information
- Unilingual French and English formats, narrow format and bilingual format
- 1 serving size declaration for the food as sold, expressed in a household measure (first) and in a metric measure (second, in brackets)
- Complete nutrition information [absolute values (g, mg) and where required, % Daily Value (DV)] for 1 serving of food as sold
- Core information is declared (Calories and 12 nutrients)
- % DV interpretative statement is mandatory
- Additional information is optional
Bilingual horizontal format
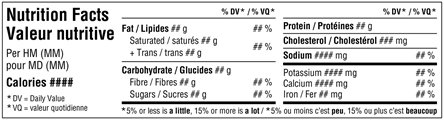
Description – Bilingual horizontal format – Figure 4.1
The first column of the table starts with the heading Nutrition Facts left justified. The next line is the heading Valeur nutritive. Both are in bold. The next line is Per HM open parenthesis MM close parenthesis. The next line is pour MD open parenthesis MM close parenthesis. The next line is Calories in bold followed by a placeholder, also in bold, for the amount of Calories per serving of the product. The next line starts with an asterisk that refers to a footnote at the bottom of the Nutrition Facts table, followed by DV equal sign Daily Value. The next line is VQ equal sign valeur quotidienne. This is the end of the first column in the table.
Column 2 of the table starts with the right-justified subheading percent symbol DV forward slash percent symbol VQ asterisk in bold. The asterisk refers to a footnote at the bottom of the Nutrition Facts table. There is a thin rule under the subheading that spans the width of the column.
Left justified on the next line is Fat, forward slash, Lipides in bold followed by a placeholder for amount of fat followed by a lowercase g. Right justified on the same line is a placeholder for percent Daily Value of fat followed by a percent symbol. Indented on the next line under Fat, forward slash, Lipides is Saturated, forward slash, saturés and a placeholder for the amount of saturated fat, followed by a lower case g. Indented on the next line is a plus symbol followed by Trans, forward slash, trans followed by a placeholder for the amount of trans fat, followed by lowercase g. There is a placeholder for the combined percent Daily Value for saturated and trans fat which is right justified and vertically centred against the saturated and trans information on the left. There is a thin rule below the trans information that spans the width of the column.
The next line is Carbohydrate, forward slash, Glucides in bold followed by a placeholder for the amount of carbohydrate followed by a lowercase g. Indented on the next line under Carbohydrate, forward slash, Glucides is Fibre, forward slash, Fibres, followed by a placeholder for the amount of fibre followed by a lowercase g. Right justified on the same line is a placeholder for percent Daily Value of Fibre followed by a percent symbol. Indented on the next line under Fibre is Sugars, forward slash, Sucres, followed by a placeholder for the amount of sugars followed by a lowercase g. Right justified on the same line is a placeholder for the percent Daily Value of sugars followed by a percent symbol. There is a thick rule under the sugars information that spans the width of the column.
Below this line is the percent Daily Value footnote that was referred to at the beginning of the table description. The footnote spans the bottom of columns 2 and 3 of the table. The footnote starts with an asterisk followed by the statement: 5 percent symbol or less is a little, 15 percent symbol or more is a lot, forward slash, asterisk 5 percent symbol ou moins, c'est peu, 15 percent symbol ou plus c'est beaucoup. The terms 'a little', 'a lot', 'peu', and 'beaucoup' are in bold.
Column 3 of the table starts with the right-justified subheading percent symbol DV or percent symbol VQ asterisk in bold. The asterisk refers to a footnote at the bottom of the Nutrition Facts table. There is a thin rule under the subheading that spans the width of the column.
The next line is Protein, forward slash, Protéines in bold followed by a placeholder for amount of protein followed by a lowercase g. There is a thin rule under the protein information that spans the width of the column.
The next line is Cholesterol, forward slash, Cholestérol in bold followed by a placeholder for the amount of cholesterol followed by mg in lowercase. There is a thin rule under the cholesterol information that spans the width of the column.
The next line is Sodium in bold followed by a placeholder for the amount followed by mg in lowercase. Right justified on the same line is a placeholder for the percent Daily Value of sodium followed by a percent symbol. There is a thick rule under the sodium information that spans the width of the column.
The next line is Potassium followed by a placeholder for the amount of potassium followed by mg in lowercase. Right justified on the same line is a placeholder for percent Daily Value of potassium followed by a percent symbol.
The next line is Calcium followed by a placeholder for the amount of calcium followed by mg in lowercase. Right justified on the same line is a placeholder for the percent Daily Value of calcium followed by a percent symbol.
The next line is Iron, forward slash, Fer followed by a placeholder for the amount of iron followed by mg in lowercase. Right justified on the same line is a placeholder for the percent Daily Value of iron followed by a percent symbol. There is a thick rule under the iron information that spans the width of the column. This is the end of the Nutrition Facts table.
- Horizontal display of nutrition information
- Bilingual format only, no unilingual tables
- Displays the same information as the standard formats
- Use of the bilingual horizontal format is limited
The second level options, bilingual horizontal format figures 4.1 and 4.2, are in the same size range as some of the first level options. These formats may only be used when:
- there is no continuous panel on the label that would accommodate any NFt listed among the first level options (standard 1.1 to 1.6, narrow standard 2.1 to 2.4, or bilingual standard 3.1 to 3.4), and/or
- manipulating the container to read a first level option printed sideways on the side panel or bottom of the package would result in leakage or damage to the product

This open-window pie box is a candidate for the bilingual horizontal format, as placing a standard format on the side or bottom of the package would result in the product being damaged when the consumer turned the package over or sideways to view the NFt.

This product illustrates incorrect use of the bilingual horizontal format. This box will accommodate a first level option, that is, standard, narrow standard or bilingual standard formats.
Linear format
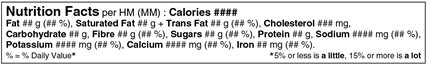
Description – Linear format – Figure 16.1
There are 5 lines of text within the table. Left justified on the first line is the heading Nutrition Facts in bold followed by Per HM, open parenthesis MM close parenthesis, followed by Calories, in bold, and a placeholder for the amount of Calories per serving of the product, also in bold.
Left justified on the next 3 lines is a horizontal list of nutrients followed by placeholders for the amount of each nutrient followed in parentheses by the percent daily value of the nutrient per serving of the product. Note: the percent daily value only applies to Fat, Saturated Fat plus Trans, Sugars, Sodium, Potassium, Calcium and Iron. Fat, Saturated Fat, Trans, Carbohydrate, Fibre, Sugars, and Protein are each followed by a lowercase g and Cholesterol, Sodium, Potassium, Calcium and Iron are each followed by a lowercase mg. All of the nutrients are in bold type. The line breaks come after Cholesterol, Sodium, and Iron, including their amount and percent DV placeholders.
The last and fifth line of text is a legend and footnote. The legend is left justified and reads: percent symbol, equal sign, percent symbol Daily Value followed by an asterisk. Right justified in the same line is the footnote: asterisk 5 percent symbol or less is a little, 15 percent symbol or more is a lot. The terms 'a little' and 'a lot' are in bold. This is the end of the Nutrition Facts table.
- Linear display of information (no columns of information)
- Unilingual formats only
- Displays the same information as the standard formats
- Limited use as it falls in third level of the decision tree (lowest level). It is generally used for small packages and packages with very small areas of continuous available display surface. However, it may also be used when the package configuration prevents the use of larger Nutrition Facts tables as only small areas of continuous space exist
While the total ADS of this package is significant, because of the configuration, only third level options will fit, for example, linear, alternate methods of presentation.
Simplified formats [B.01.455, FDR]
Purpose: The simplified formats are designed for foods that contain a limited number of nutrients. These formats provide nutrient information for 1 serving of food as sold. However, they do not declare all 12 nutrients and Calories in the core list and, consequently, are smaller than standard format Nutrition Facts tables.
The table Which Nutrition Facts table format family should I use provides guidance on when this format is appropriate for use.
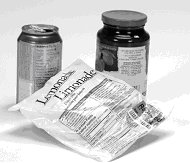
Some jams, jellies, fruit flavoured drinks, drink mix powders, and diet soft drinks meet the criteria for the simplified format.
Simplified formats: hierarchy of formats decision tree
Click on image for larger view
Description – Simplified formats: hierarchy of formats decision tree
First level options: Steps for choosing between the standard formats
- Manufacturers may choose format 5 or 6. Simplified standard (figures 5.1 to 5.6) or bilingual simplified standard (figures 6.1 to 6.4).
- Within the desired format, choose the largest version that will fit on 15% ADS and one continuous surface of the package.
- All first level options must be exhausted before proceeding to next level.
Second level options: Steps for choosing between the horizontal formats
- Choose the largest version of format (figures 7.1 to 7.2) that will fit on 15% ADS and one continuous surface of the package.
- All second level options must be exhausted before proceeding to next level.
Third level options: Steps for choosing between the linear formats
- May choose any format, any version: bilingual simplified standard (figures 6.5 to 6.6), bilingual simplified horizontal (figures 7.3 to 7.4), simplified linear (figures 17.1 to 17.2) or alternative methods of presentation such as tags, package inserts, inner labels, fold-out labels, overwraps or collars.
For package inserts and inner labels, the outer label must indicate where to find the NFt.
What nutrients must be declared in the simplified formats [B.01.401(6), FDR]
- Calories
- fat
- carbohydrate
- protein
- any other nutrient in the core list (that is, saturated fat, trans fat, fibre, sugars, cholesterol, sodium, potassium, calcium, iron) that cannot be expressed as "0"
- any nutrient that is the subject of a statement, claim or representation
- any sugar alcohol, vitamin or mineral nutrient added to the product (other than iodine added to table salt, or fluoride added to water or ice)
- any vitamin or mineral nutrient declared as a component of 1 of the product's ingredients other than flour, and
- a footnote: "Not a significant source of (naming the excluded core nutrients)" or for Nutrition Facts tables in the third level of options in the decision tree, "Not a significant source of other nutrients"
- % Daily Value interpretative statement is included in all figures of the simplified formats in the first and second level options, as well as figure 17.1 of the simplified linear format. This interpretive statement is not required for the following figures in the third level:
- bilingual simplified standard format (figures 6.5 to 6.6)
- bilingual simplified horizontal format (figures 7.3 to 7.4)
- simplified linear format (figure 17.2) [B.01.401(8), FDR]
Note: Values that are "0" and are not required to be declared may be voluntarily declared in the NFt. For example, if the value for sodium in a food that qualifies for the simplified format is 0 mg, it may still be included.
Major distinguishing features of the simplified formats
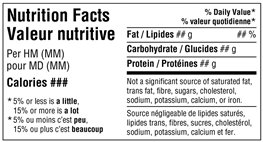
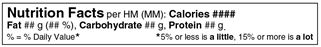
Simplified standard format
Description – Simplified standard format – Figure 5.1
Left justified at the top of the table is the heading Nutrition Facts in bold. The next line is Per HM open parenthesis MM close parenthesis. There is a rule below Per HM open parenthesis MM close parenthesis that spans the width of the table. The next line is Calories in bold followed by a placeholder, also in bold, for the amount of Calories per serving of the product. Right justified on the same line is the subheading percent symbol Daily Value in bold. Percent symbol Daily is on top of Value. Percent Daily Value has an asterisk that refers to a footnote at the bottom of the Nutrition Facts table. There is a thick rule under Calories that ends after the amount placeholder; it does not span the width of the table.
Left justified on the next line is Fat in bold followed by a placeholder for amount of fat followed by a lowercase g. Right justified on the same line is a placeholder for the percent Daily Value of fat followed by a percent symbol. There is a thin line under Fat that spans the width of the table.
The next line is Carbohydrate in bold followed by a placeholder for the amount of carbohydrate followed by a lowercase g. There is a thin line under Carbohydrate that spans the width of the table.
The next line is Protein in bold followed by a placeholder for amount of protein followed by a lowercase g. There is a thick rule under the Protein that spans the width of the table.
The next 4 lines are the footnote: Not a significant source of saturated fat, trans fat, fibre, sugars, cholesterol, sodium, potassium, calcium or iron. There is a thin rule below this footnote.
The next 2 lines is the percent Daily Value footnote that was referred to at the beginning of the table description. The footnote starts with an asterisk followed by the statement: 5 percent symbol or less is a little, with 'a little' in bold. The next line is 15 percent symbol or more is a lot with 'a lot' in bold. This is the end of the Nutrition Facts table.
- Vertical display of nutrition information
- Unilingual French and English formats and bilingual format
- One serving size declaration for the food as sold, expressed in a household measure (first) and in a metric measure (second, in brackets)
- Nutrition information [absolute values (g, mg) and where required, % Daily Value (DV)] presented for 1 serving of food as sold
- Not all core information is required to be declared. Only Calories, fat, carbohydrates, protein and triggered core and additional information must be declared
- Footnote: "Not a significant source of (naming the core nutrients not declared)" or "Not a significant source of other nutrients." The second, abbreviated footnote may be used on smaller versions of the bilingual simplified standard format (figures 6.5 to 6.6)
- % DV interpretative statement is included in the simplified standard formats but is not required in the smaller versions of the bilingual simplified standard format (that is, figures 6.5 to 6.6)
- Additional information is optional
Bilingual simplified horizontal
Description – Bilingual simplified horizontal format – Figure 7.1
The first column of the table starts with the heading Nutrition Facts left justified and stacked below it is the heading Valeur nutritive. Both are in bold. The next line is Per HM open parenthesis MM close parenthesis. The next line is pour MD open parenthesis MM close parenthesis. The next line is Calories in bold followed by a placeholder, also in bold, for the amount of Calories per serving of the product. The next 4 lines are the Daily Value footnote. The first line of the footnote starts with an asterisk followed by 5 percent symbol or less is a little. The next line is 15 percent symbol or more is a lot, forward slash. The next line is 5 percent symbol ou moins c'est peu. The last line is 15 percent symbol ou plus c'est beaucoup. A little, a lot, peu, and beaucoup are in bold.
Right justified at the top of column 2 is the subheading percent symbol Daily Value followed by an asterisk that refers to a footnote in column one of the Nutrition Facts table. The next line is percent symbol valeur quotidienne. Both are in bold. There is a thin rule under percent symbol valueur quotidienne that spans the width of the column.
Left justified on the next line is Fat, forward slash, Lipides in bold followed by a placeholder for amount of fat followed by a lowercase g. Right justified on the same line is a placeholder for percent Daily Value of fat followed by a percent symbol. There is a thin line under the fat information that spans the width of the column.
The next line is Carbohydrate, forward slash, Glucides in bold followed by a placeholder for the amount of carbohydrate followed by a lowercase g. There is a thin line under the carbohydrate information that spans the width of the column.
The next line is Protein, forward slash, Protéines in bold followed by a placeholder for amount of protein followed by a lowercase g. There is a thick rule under the protein information that spans the width of the column.
The next 3 lines are a footnote which says: Not a significant source of saturated fat, trans fat, fibre, sugars, cholesterol, sodium, potassium, calcium or iron. There is a thin rule below this footnote. The next 3 lines are a footnote which says: Source négligeable de lipides saturés, lipides trans, fibres, sucres, cholestérol, sodium, potassium, calcium et fer. This is the end of the Nutrition Facts table.
- Horizontal display of nutrition information
- Bilingual format only, no unilingual tables
- Displays the same information as the simplified standard formats
- Smaller versions of the bilingual simplified horizontal format, figures 7.3 to 7.4, may declare the abbreviated footnote: "Not a significant source of other nutrients."
- % DV interpretative statement is not required in smaller versions of the bilingual simplified horizontal format (that is, figures 7.3 to 7.4)
- The second level options, bilingual simplified horizontal format figures 7.1 and 7.2, may only be used when:
- there is no continuous panel on the label that would accommodate any NFt listed among the first level options (simplified standard 5.1 to 5.6, or bilingual simplified standard 6.1 to 6.4), and/or
- manipulating the container to read a first level option printed sideways on the side panel or bottom would result in leakage or damage to the product
Simplified linear format
Description – Simplified linear format – Figure 17.1
There are 3 lines of text within the table. Left justified on the first line is the heading Nutrition Facts in bold followed by per HM, open parenthesis MM close parenthesis, followed by Calories, in bold, and a placeholder for the amount of Calories per serving of the product, also in bold.
Left justified on the second line is Fat, in bold, followed by a placeholder for the amount and percent Daily Value of fat in parentheses. The amount placeholder is followed by a lowercase g and the percent daily value is followed by a percent symbol. Following on the same line is Carbohydrate, in bold, followed by a placeholder for the amount of carbohydrate followed by a lowercase g. Protein is next, in bold, followed by a placeholder for the amount of protein followed by a lowercase g.
Left justified on the third line is the legend: percent symbol, followed by equal sign percent symbol Daily Value, followed by an asterisk. The asterisk refers to a footnote at the bottom of the Nutrition Facts table. Right justified on the same line is the percent Daily Value footnote that was referred to in the legend. The footnote starts with an asterisk followed by 5 percent symbol or less is a little, 15 percent symbol or more is a lot. The terms 'a little' and 'a lot' are in bold. This is the end of the Nutrition Facts table.
- Linear display of information (no columns of information)
- Unilingual formats only
- Displays the same information as the simplified standard format
- Linear formats may declare the abbreviated footnote: "Not a significant source of other nutrients."
- % Daily Value interpretative statement is not required in smaller versions of the simplified linear format (that is, figure 17.2)
Simplified formats – single-serving prepackaged products [B.01.455.1, FDR]
Purpose: The simplified formats – single-serving prepackaged products are designed specifically for single-serving prepackaged products with little nutritional value, and do not apply to single-serving prepackaged meals.
These formats provide nutrient information for the package contents as sold. Since single-serving prepackaged products face space challenges in trying to accommodate all labelling requirements, they may omit certain nutrients, as well as the "Not a significant source of …" footnote.
The majority of products that tend to be sold in single-serve packages are snack foods. While the intent is to provide information on the negative nutrients from a public health standpoint (for example, trans + saturated fat, sugars, sodium), the amounts of cholesterol, dietary fibre, potassium, calcium or iron are not likely to be as relevant to consumers of snack foods and are therefore not required. However, manufacturers may voluntarily add this information back into the table if they wish.
The table Which Nutrition Facts table format family should I use provides guidance on when this format is appropriate for use. Single-serve packages of snack foods, such as chocolate bars and potato chips, meet the criteria for the simplified format – single-serving prepackaged products.
Simplified formats – single-serving prepackaged products: hierarchy of formats decision tree
Click on image for larger view

Description – Simplified formats – single-serving prepackaged products: hierarchy of format decision tree
First level options: steps for choosing between the standard formats
- Choose the largest version of format (figures 6.1.1 to 6.4.1) that will fit on 15% ADS and one continuous surface of the package.
- All first level options must be exhausted before proceeding to next level.
Second level options: steps for choosing between the horizontal formats
- Choose the largest version of format (figures 7.1.1 to 7.2.1) that will fit on 15% ADS and one continuous surface of the package.
- All second level options must be exhausted before proceeding to next level.
Third level options: steps for choosing between the linear formats
- May choose any format, any version: bilingual simplified standard – single-serving prepackaged products (figures 6.5.1 to 6.6.1), bilingual simplified horizontal – single-serving prepackaged products (figures 7.3.1 to 7.4.1), simplified linear format – single-serving prepackaged products (figures 17.1.1 to 17.2.1) or alternative methods of presentation such as tags, package inserts, inner labels, fold-out labels, overwraps or collars.
For package inserts and inner labels, the outer label must indicate where to find the NFt.
What nutrients must be declared in the simplified formats – single-serving prepackaged products [B.01.401(6.1), FDR]
- Calories
- fat
- saturated fat, trans fats, and the sum of saturated and trans fats must all be declared if the value of any one or the sum is not expressed as "0"
- carbohydrate
- protein
- any of the following core nutrients that cannot be expressed as "0": sugars, sodium
- any nutrient that is the subject of a statement, claim or representation
- any sugar alcohol, vitamin or mineral nutrient added to the product (other than iodine added to table salt, or fluoride added to water or ice)
- % Daily Value interpretative statement is included in all simplified formats – single-serving prepackaged products in the first and second level options, as well as Figure 17.1.1 of the simplified linear format – single-serving prepackaged products. This interpretive statement is not required for the following figures in the third level options:
- bilingual simplified standard format – single-serving prepackaged products (figures 6.5.1 to 6.6.1)
- bilingual simplified horizontal standard format – single-serving prepackaged products (figures 7.3.1 to 7.4.1)
- simplified linear format – single-serving prepackaged products (figure 17.2.1) [B.01.401(8), FDR]
Note: Values that are "0" and are not required to be declared may be voluntarily declared in the NFt. For example, if the value for sodium in a food that qualifies for the simplified format for single-serving prepackaged products is 0 mg, it may still be included.
Major distinguishing features of the simplified formats – single-serving prepackaged products
Bilingual simplified standard – single-serving prepackaged products

Description – Bilingual simplified standard – single-serving prepackaged products – Figure 6.1.1
Left justified at the top of the table is the heading Nutrition Facts and stacked below it is the heading Valeur nutritive. Both are in bold. The next line is Per HM open parenthesis MM close parenthesis. The next line is pour MD open parenthesis MM close parenthesis. There is a thin rule below pour MD open parenthesis MM close parenthesis that spans the width of the table. The next line is Calories in bold followed by a placeholder, also in bold, for the amount of Calories per serving of the product. Right justified on the same line is the subheading percent symbol Daily Value in bold. Stacked under this is percent symbol valeur quotidienne in bold. Percent Daily Value has an asterisk that refers to a footnote at the bottom of the Nutrition Facts table. There is a thick rule under Calories that ends after the amount placeholder; it does not span the width of the table.
Left justified on the next line is Fat, forward slash, Lipides in bold followed by a placeholder for amount of fat followed by a lowercase g. Right justified on the same line is a placeholder for percent Daily Value of fat followed by a percent symbol. There is a thin line under the fat information that spans the width of the table.
The next line is Carbohydrate, forward slash, Glucides in bold followed by a placeholder for the amount of carbohydrate followed by a lowercase g. There is a thin line under the carbohydrate information that spans the width of the table.
The next line is Protein, forward slash, Protéines in bold followed by a placeholder for amount of protein followed by a lowercase g. There is a thick rule under the protein information that spans the width of the table.
The next line is the percent Daily Value footnote that was referred to at the beginning of the table description. The footnote starts with an asterisk followed by 5 percent symbol or less is a little, forward slash, asterisk 5 percent symbol ou moins c'est peu, The next line is 15 percent symbol or more is a lot, forward slash, 15 percent symbol ou plus c'est beaucoup. The terms 'a little', 'peu', 'a lot', and 'beaucoup' are in bold. This is the end of the Nutrition Facts table.
- Vertical display of nutrition information
- Bilingual formats only, no unilingual tables
- One serving size declaration for the food as sold, expressed in a household measure (first) and in a metric measure (second, in brackets)
- Nutrition information [absolute values (g, mg) and where required, % Daily Value (DV)] presented for the entire package contents
- Not all core information is required to be declared. The footnote "Not a significant source of …" is not required
- % DV interpretative statement is not required in smaller versions of the bilingual simplified standard format (that is, figures 6.5.1 and 6.6.1)
- Additional information is optional
Bilingual simplified horizontal – single-serving prepackaged products

Description – Bilingual simplified standard – single-serving prepackaged products – Figure 7.1.1
The first column of the table starts with the heading Nutrition Facts left-justified. The next line is the heading Valeur nutritive. Both are in bold. The next line is Per HM open parenthesis MM close parenthesis. The next line is pour MD open parenthesis MM close parenthesis. The next line is Calories in bold followed by a placeholder, also in bold, for the amount of Calories per serving of the product.
Right justified at the top of column 2 is the subheading percent symbol Daily Value followed by an asterisk that refers to a footnote at the bottom of column 2 of the Nutrition Facts table. The next line is percent symbol valeur quotidienne. Both are in bold. There is a thin rule under percent symbol valueur quotidienne that spans the width of the column.
Left justified on the next line is Fat, forward slash, Lipides in bold followed by a placeholder for amount of fat followed by a lowercase g. Right justified on the same line is a placeholder for percent Daily Value of fat followed by a percent symbol. There is a thin line under the fat information that spans the width of the column.
The next line is Carbohydrate, forward slash, Glucides in bold followed by a placeholder for the amount of carbohydrate followed by a lowercase g. There is a thin line under the carbohydrate information that spans the width of the column.
The next line is Protein, forward slash, Protéines in bold followed by a placeholder for amount of protein followed by a lowercase g. There is a thick rule under the protein information that spans the width of the column.
The next 3 lines is the percent Daily Value footnote that was referred to by the asterisk at the top of column 2. The footnote starts with an asterisk followed by 5 percent symbol or less is a little, 15 percent symbol or more is a lot, forward slash asterisk 5 percent symbol ou moins c'est peu, 15 percent symbol ou plus c'est beaucoup. The terms 'a little', 'peu', 'a lot', and 'beaucoup' are in bold. This is the end of the Nutrition Facts table.
- Horizontal display of nutrition information
- Bilingual format only, no unilingual tables
- Displays the same information as the simplified standard – single-serving prepackaged products formats
- % Daily Value interpretative statement is not required in smaller versions of the bilingual simplified horizontal format (that is, figures 7.3.1 to 7.4.1)
- The second level options, bilingual simplified horizontal format figures 7.1.1 and 7.2.1, may only be used when:
- there is no continuous panel on the label that would accommodate any NFt listed among the first level options (bilingual simplified standard – single-serving prepackaged products figures 6.1.1 to 6.4.1), and/or
- manipulating the container to read a first level option printed sideways on the side panel or bottom would result in leakage or damage to the product
The following alternate figure illustrates how this bilingual simplified horizontal format could look like when saturated and trans fats, sugars and sodium values cannot be expressed as "0".
Simplified linear format – single-serving prepackaged products
Description – Simplified linear format – single-serving prepackaged products – Figure 17.1.1
There are 3 lines of text within the table. Left justified on the first line is the heading Nutrition Facts in bold followed by per HM, open parenthesis MM close parenthesis, followed by Calories, in bold, and a placeholder for the amount of Calories per serving of the product, also in bold.
Left justified on the second line is Fat, in bold, followed by a placeholder for the amount and percent Daily Value of fat in parentheses. The amount placeholder is followed by a lowercase g and the percent daily value is followed by a percent symbol. Following on the same line is Carbohydrate, in bold, followed by a placeholder for the amount of carbohydrate followed by a lowercase g. Protein is next, in bold, followed by a placeholder for the amount of protein followed by a lowercase g.
Left justified on the third line is the legend: percent symbol, followed by equal sign percent symbol Daily Value, followed by an asterisk. The asterisk refers to a footnote at the bottom of the Nutrition Facts table. Right justified on the same line is the percent Daily Value footnote that was referred to in the legend. The footnote starts with an asterisk followed by 5 percent symbol or less is a little, 15 percent symbol or more is a lot. The terms 'a little' and 'a lot' are in bold. This is the end of the Nutrition Facts table.
- Linear display of information (no columns of information)
- Unilingual format only
- Displays the same information as the bilingual simplified standard – single-serving prepackaged products format
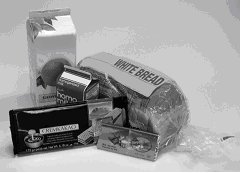
Dual format – foods requiring preparation [B.01.456, FDR]
Purpose: The dual format – foods requiring preparation provides nutrition information for both the food as sold and for the food as it is usually consumed.
The table Which Nutrition Facts table format family should I use provides guidance on when this format is appropriate for use.
This box of cereal may use the dual format – foods requiring preparation to provide nutrition information for the cereal as sold, as well as for the cereal as consumed with milk.
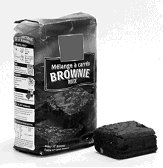
This powder based mix may use the dual format – foods requiring preparation to provide nutrition information for the food as sold (powder mix) and for the food as prepared.
Note: In cases where the nutrition information for the food is not altered by the preparation – where the nutrition information is the same for the food as sold and for the food as prepared – a standard, bilingual horizontal, linear or simplified format may be used. Note that in these cases, the serving size declaration is modified to include a declaration for the food as prepared in addition to the food as sold. The serving size for the "Prepared" food includes the household measure only, not the metric measure. For drink crystals to be prepared with added water, for example, the serving size may be declared as "Per 1 tbsp (2 g) (about 1 cup prepared)". Other examples include frozen concentrated juice to be prepared with added water, some popping corn.
Dual format – foods requiring preparation: hierarchy of formats decision tree
Click on image for larger view
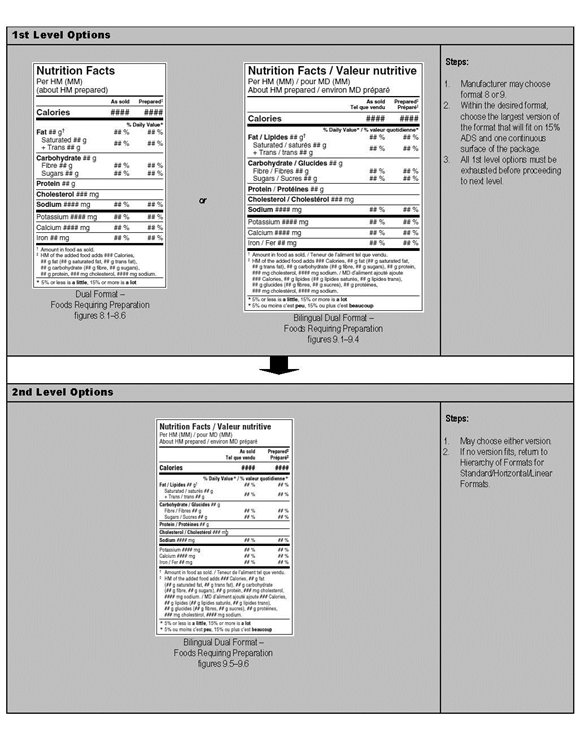
Description – Dual format – food requiring preparation: hierarchy of formats decision tree
First level options: Steps for choosing between the dual formats
- Manufacturer may choose format 8 or 9. Dual format (figures 8.1 to 8.6) or bilingual dual format (figures 9.1 to 9.4).
- Within the desired format, choose largest version of format that will fit on 15% ADS and one continuous surface of the package.
- All first level options must be exhausted before proceeding to next level.
Second level options: Steps for choosing a format when first level options are exhausted
- May choose either version of bilingual dual format (figures 9.5 to 9.6).
- If no version fits, return to hierarchy of format for standard/horizontal/linear formats
Major distinguishing features of the dual format – foods requiring preparation
The format of the dual format – foods requiring preparation is modified slightly depending on whether the food is to be prepared (for example, cake mix) or is served combined with another food (for example, cereal and milk). Examples of both variations are provided.
Food requiring preparation (for example, cake mix)
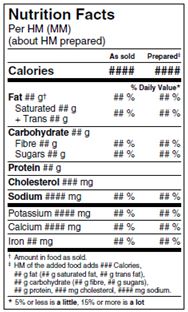
Description – Dual format – foods requiring preparation
Left justified at the top of the table is the heading Nutrition Facts in bold. The next line is Per HM open parenthesis MM close parenthesis. The next line is open parenthesis about HM prepared close parenthesis. There is a rule below open parenthesis about HM prepared close parenthesis that spans the width of the table.
The next line starts with a blank cell with no information. Right justified in columns 2 and 3 are the subheadings As sold and Prepared. These are in bold. There is a double dagger symbol following Prepared which refers to a footnote at the bottom of the Nutrition Facts table.
Left justified on the next line is Calories, in bold, followed by a set of placeholders, also in bold, for the amount of Calories per serving of the product as sold and prepared. There is a thick rule under the Calories information that spans the width of the table.
The next line starts with a blank cell with no information. Centred above the columns 2 and 3 is the subheading percent symbol Daily Value, in bold, followed by an asterisk which refers to a footnote at the bottom of the table.
Left justified on the next line is Fat, in bold, followed by a placeholder for the amount of fat followed by a lowercase g. The lowercase letter g is followed by a dagger symbol which refers to a footnote at the bottom of the table. Right justified on the same line in columns 2 and 3 are placeholders for the percent Daily Value of fat as sold and prepared. The placeholders are followed by percent symbols. Indented on the next line is Saturated followed by a placeholder for the amount of saturated fat followed by a lowercase g. Indented on the next line is a plus symbol followed by Trans followed by a placeholder for the amount of trans fat followed by a lowercase g. There are placeholders in columns 2 and 3 for the combined percent Daily Value for saturated and trans fat as sold and prepared, which are right justified and vertically centred against saturated and trans information on the left. There is a thin rule below the trans information that spans the width of the table.
The next line is Carbohydrate, in bold, followed by a placeholder for the amount of carbohydrate followed by lowercase g. Indented on the next line is Fibre followed by a placeholder for the amount of Fibre followed by a lowercase g. Right justified in columns 2 and 3 on the same line are placeholders for the percent Daily Value of Fibre per serving of the product as sold and prepared. The placeholders are followed by percent symbols. Indented on the next line is Sugars followed by a placeholder for the amount of sugars followed by a lowercase g. Right justified in columns 2 and 3 on the same line are placeholders for the percent Daily Value of sugars per serving of the product as sold and prepared. The placeholders are followed by percent symbols. There is a thin rule under the sugars information that spans the width of the table.
The next line is Protein, in bold, followed by a placeholder for the amount of protein followed by a lowercase g. There is a thin rule under the protein information that spans the width of the table.
The next line is Cholesterol, in bold, followed by a placeholder for the amount of cholesterol followed by mg in lowercase. There is a thin rule under the cholesterol information that spans the width of the table.
The next line is Sodium, in bold, followed by a placeholder for the amount of sodium followed by mg in lowercase. Right justified on the same line in columns 2 and 3 are placeholders for the percent Daily Value of sodium as sold and prepared. The placeholders are followed by percent symbols. There is a thick rule under the sodium information that spans the width of the table.
The next line is Potassium followed by a placeholder for the amount of potassium followed by mg in lowercase. Right justified on the same line in columns 2 and 3 are placeholders for the percent Daily Value of potassium as sold and prepared. The placeholders are followed by percent symbols. There is a thin rule under the potassium information that spans the width of the table.
The next line is Calcium followed by a placeholder for the amount of calcium followed by mg in lowercase. Right justified on the same line in columns 2 and 3 are placeholders for the percent Daily Value of calcium as sold and prepared. The placeholders are followed by percent symbols. There is a thin rule below the calcium information that spans the width of the table.
The next line is Iron followed by a placeholder for the amount of iron followed by mg in lowercase. Right justified on the same line in columns 2 and 3 are placeholders for the percent Daily Value of iron as sold and prepared. The placeholders are followed by percent symbols. There is a thick rule under the iron information that spans the width of the table.
The next 6 lines are the footnotes. The first line is the dagger symbol footnote which says: Amount in food as sold. The next line is the double dagger symbol footnote which says: HM of the added food adds set of placeholders for the amount of calories, followed by calories. The third line is: placeholder for the amount of fat followed by a lowercase g, followed by fat open parenthesis placeholder for the amount of saturated fat followed by a lowercase g, followed by saturated fat, placeholder for the amount of trans fat followed by a lowercase g, followed by trans fat close parenthesis. The fourth line is: placeholder for the amount of carbohydrate followed by a lowercase g, followed by carbohydrate open parenthesis placeholder for the amount of fibre followed by a lowercase g, followed by fibre, placeholder for the amount of sugars followed by a lowercase g, followed by sugars close parenthesis. The fifth line is: placeholder for the amount of protein followed by a lowercase g, followed by protein, placeholder for the amount of cholesterol followed by a lowercase mg, followed by cholesterol, placeholder for the amount of sodium followed by a lowercase mg, followed by sodium. There is an arrow pointing to this footnote that says it is optional. There is a thin rule under this footnote that spans the width of the table.
The next line is the percent Daily Value footnote. It starts with an asterisk followed by the statement: 5 percent symbol or less is a little, 15 percent symbol or more is a lot. The terms 'a little' and 'a lot' are in bold. This is the end of the Nutrition Facts table.
Nutrition Facts table
- Vertical display of nutrition information
- Unilingual French and English formats and bilingual format
Serving size and sub-headings
- There are 2 serving size declarations: for the food as sold, and for the food as prepared
- Food as sold is declared in a household measure (first) and in a metric measure (second, in brackets)
- Food as prepared is declared in a household measure, with the statement "about (naming the serving size)" or "about (naming the serving size) prepared"
- Sub-headings (next line of information) – "As sold" and "Prepared". (Note: In the case of a cake mix, the "As sold" sub-heading may be modified and declared as "Dry mix", for example)
Nutrient declarations
Food as sold
- Complete nutrition information for the food as sold, declared in absolute values (g, mg), immediately following the nutrient description and where required, % Daily Value (DV)
- Core information is declared (Calories and 12 nutrients); and
- Additional nutrients may be declared
Food as prepared
- Calories
- % DV for any nutrient that is declared as a % DV for the food as sold, and
- Absolute values are not declared for the prepared food
Footnotes
- A mandatory footnote links the absolute values (g, mg) declared in the NFt to the product as sold, for example, "† Amount in food as sold". See the symbol † attached to the "fat" declaration
- An optional footnote ‡ presents the amount of nutrients provided by the added ingredients in absolute values (g, mg). See the symbol ‡ attached to the "Prepared" sub-heading. Note that these values represent the nutrient content of the added foods only, not the total nutrient value of the prepared product. For example, in the case of a cake mix, this footnote sets out the nutrient value of the added eggs and milk, not the nutrient value of the final prepared cake
- % DV interpretative statement is included in all versions of the dual format – foods requiring preparation
Note: Variations in sub-headings are possible to describe the different forms of the food for which information is provided. This format can also be used for products as cooked that do not have any ingredients added (for example, bacon "As sold" and "Cooked") or for products as drained (for example, sardines in oil "As sold" and "Drained"). As there are no ingredients added in these cases, the optional footnote stated above which presents the amount of nutrients provided by added ingredients does not apply. The serving size for the "Prepared" food includes the household measure only, not the metric measure.
Combined food (for example, cereal and milk)
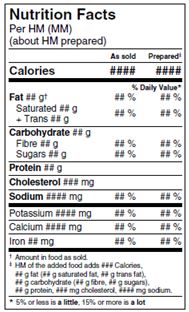
Description – Dual format – combined food
Left justified at the top of the table is the heading Nutrition Facts in bold. The next line is Per HM open parenthesis MM close parenthesis. The next line is open parenthesis about HM prepared close parenthesis. There is a rule below open parenthesis about HM prepared close parenthesis that spans the width of the table.
The next line starts with a blank cell with no information. Right justified in columns 2 and 3 are the subheadings As sold and Prepared. These are in bold. There is a double dagger symbol following Prepared which refers to a footnote at the bottom of the Nutrition Facts table.
Left justified on the next line is Calories, in bold, followed by a set of placeholders, also in bold, for the amount of Calories per serving of the product as sold and prepared. There is a thick rule under the Calories information that spans the width of the table.
The next line starts with a blank cell with no information. Centred above the columns 2 and 3 is the subheading percent symbol Daily Value, in bold, followed by an asterisk which refers to a footnote at the bottom of the table.
Left justified on the next line is Fat, in bold, followed by a placeholder for the amount of fat followed by a lowercase g. The lowercase letter g is followed by a dagger symbol which refers to a footnote at the bottom of the table. Right justified on the same line in columns 2 and 3 are placeholders for the percent Daily Value of fat as sold and prepared. The placeholders are followed by percent symbols. Indented on the next line is Saturated followed by a placeholder for the amount of saturated fat followed by a lowercase g. Indented on the next line is a plus symbol followed by Trans followed by a placeholder for the amount of trans fat followed by a lowercase g. There are placeholders in columns 2 and 3 for the combined percent Daily Value for saturated and trans fat as sold and prepared, which are right justified and vertically centred against saturated and trans information on the left. There is a thin rule below the trans information that spans the width of the table.
The next line is Carbohydrate, in bold, followed by a placeholder for the amount of carbohydrate followed by lowercase g. Indented on the next line is Fibre followed by a placeholder for the amount of Fibre followed by a lowercase g. Right justified in columns 2 and 3 on the same line are placeholders for the percent Daily Value of Fibre per serving of the product as sold and prepared. The placeholders are followed by percent symbols. Indented on the next line is Sugars followed by a placeholder for the amount of sugars followed by a lowercase g. Right justified in columns 2 and 3 on the same line are placeholders for the percent Daily Value of sugars per serving of the product as sold and prepared. The placeholders are followed by percent symbols. There is a thin rule under the sugars information that spans the width of the table.
The next line is Protein, in bold, followed by a placeholder for the amount of protein followed by a lowercase g. There is a thin rule under the protein information that spans the width of the table.
The next line is Cholesterol, in bold, followed by a placeholder for the amount of cholesterol followed by mg in lowercase. There is a thin rule under the cholesterol information that spans the width of the table.
The next line is Sodium, in bold, followed by a placeholder for the amount of sodium followed by mg in lowercase. Right justified on the same line in columns 2 and 3 are placeholders for the percent Daily Value of sodium as sold and prepared. The placeholders are followed by percent symbols. There is a thick rule under the sodium information that spans the width of the table.
The next line is Potassium followed by a placeholder for the amount of potassium followed by mg in lowercase. Right justified on the same line in columns 2 and 3 are placeholders for the percent Daily Value of potassium as sold and prepared. The placeholders are followed by percent symbols. There is a thin rule under the potassium information that spans the width of the table.
The next line is Calcium followed by a placeholder for the amount of calcium followed by mg in lowercase. Right justified on the same line in columns 2 and 3 are placeholders for the percent Daily Value of calcium as sold and prepared. The placeholders are followed by percent symbols. There is a thin rule below the calcium information that spans the width of the table.
The next line is Iron followed by a placeholder for the amount of iron followed by mg in lowercase. Right justified on the same line in columns 2 and 3 are placeholders for the percent Daily Value of iron as sold and prepared. The placeholders are followed by percent symbols. There is a thick rule under the iron information that spans the width of the table.
The next 6 lines are the footnotes. The first line is the dagger symbol footnote which says: Amount in food as sold. The next line is the double dagger symbol footnote which says: HM of the added food adds set of placeholders for the amount of calories, followed by calories. The third line is: placeholder for the amount of fat followed by a lowercase g, followed by fat open parenthesis placeholder for the amount of saturated fat followed by a lowercase g, followed by saturated fat, placeholder for the amount of trans fat followed by a lowercase g, followed by trans fat close parenthesis. The fourth line is: placeholder for the amount of carbohydrate followed by a lowercase g, followed by carbohydrate open parenthesis placeholder for the amount of fibre followed by a lowercase g, followed by fibre, placeholder for the amount of sugars followed by a lowercase g, followed by sugars close parenthesis. The fifth line is: placeholder for the amount of protein followed by a lowercase g, followed by protein, placeholder for the amount of cholesterol followed by a lowercase mg, followed by cholesterol, placeholder for the amount of sodium followed by a lowercase mg, followed by sodium. There is an arrow pointing to this footnote that says it is optional. There is a thin rule under this footnote that spans the width of the table.
The next line is the percent Daily Value footnote. It starts with an asterisk followed by the statement: 5 percent symbol or less is a little, 15 percent symbol or more is a lot. The terms 'a little' and 'a lot' are in bold. This is the end of the Nutrition Facts table.
Nutrition Facts table
- Vertical display of nutrition information.
- Unilingual French and English formats and bilingual format.
Serving size and sub-headings
- There is 1 serving size for the food as sold, declared in a household measure (first) and in a metric measure (second, in brackets).
- Note: The "(about HM prepared)" does not apply in the case of food that is served combined with another food [B.01.406(5)(a)(i), FDR]. The combined food is therefore not part of the serving size declaration.
- Sub-headings (next line of information) – "As sold" and, for a food that is served combined with another food, the sub-heading "Prepared" is replaced with the amount of added food in a household measure only (for example, "With ½ cup skim milk") [B.01.406(5)(a)(ii), FDR].
Nutrients and footnotes
- Same as Dual format – foods requiring preparation (for example, cake mix)
- In the case of cereal served with skim milk, the optional footnote ‡ sets out the nutrient value of the added skim milk [for example, 1/2 cup skim milk adds 40 Calories, 6 g carbohydrate (6 g sugars), 4 g protein, 65 mg sodium]
Aggregate format – different kinds of foods [B.01.457, FDR]
Purpose: The aggregate format – different kinds of foods provides nutrition information for 2 or more foods or ingredients in a prepackaged product.
The table Which Nutrition Facts table format family should I use provides guidance on when this format is appropriate for use.

The aggregate format – different kinds of foods is suitable for this multi-pack of granola bars. Each bar is a single serving and has a unique nutrient profile.
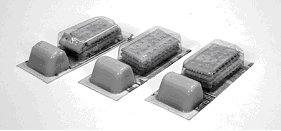
This snack ensemble may use the aggregate format – different kinds of foods to present the nutrition information for the individual foods. Use of the aggregate format – different kinds of foods is optional.

The aggregate format – different kinds of foods may be used to provide nutrition information for each type of chocolate. Use of the aggregate format – different kinds of foods is optional.
This format may also be used for multi-use packages (for example, a container that is used to package a variety of dips, where the same NFt and package would be used each time) provided it is clear which nutrition information applies to which product.

The aggregate format – different kinds of foods may not be used for this multi-pack of frozen ices, where each frozen ice is 1 serving of food and the nutrient information for all the frozen ices is the same.
Aggregate format – different kinds of food: hierarchy of formats decision tree
Click on image for larger view
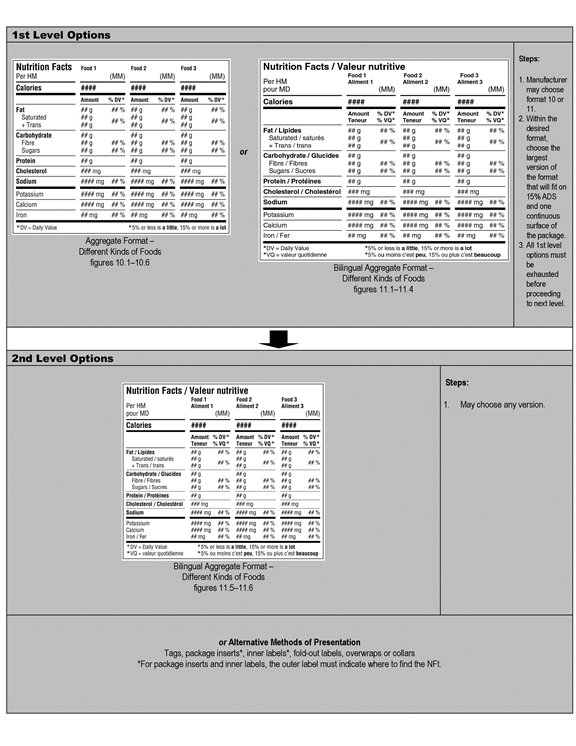
Description – Aggregate format – different kinds of food: hierarchy of formats decision tree
First level options: Steps for choosing between the aggregate formats
- Manufacturer may choose format 10 or 11. Aggregate format (figures 10.1 to 10.6) or bilingual aggregate format (figures 11.1 to 11.4).
- Within the desired format, choose the largest version of format that will fit on 15% ADS and one continuous surface of the package.
- All first level options must be exhausted before proceeding to next level.
Second level options: Steps for choosing a format when first level options are exhausted
- May choose any version: bilingual aggregate format (figures 11.5 to 11.6) or alternative methods of presentation
Aggregate format
Major distinguishing features of the Aggregate format – different kinds of foods
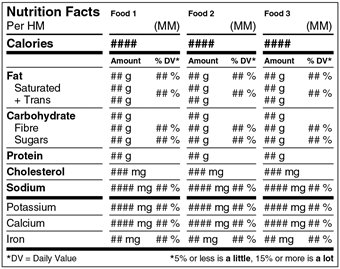
Description – Aggregate format – different kinds of foods – Figure 10.1
The table is divided into 4 columns. Left justified at the top of the first column is the heading Nutrition Facts in bold. On the same line and at the top of columns 2, 3 and 4 are the subheadings Food 1, Food 2 and Food 3. These are placeholders for the different name or flavour variations of the food. Below the Nutrition Facts heading, in the first column, is Per HM. On the same line in columns 2, 3 and 4 and right justified is MM in parentheses. There is a rule below the Per HM and MM in parentheses subheadings that spans the width of each column. Note: it is not a continuous line; there is a space in the line between each of the columns.
Below Per HM is Calories, in bold, followed by placeholders, also in bold, for the amount of Calories per serving of the product in columns 2, 3 and 4. There is a thick rule under Calories and the placeholders that spans the width of each column. Note, it is not a continuous line; there is a space in the line between each of the columns.
On the next line below the Calories information there is a blank cell with no information. In the same line under the amount of Calories placeholders in columns 2, 3 and 4 are the subheadings Amount and Percent symbol DV in bold. There is an asterisk after each percent symbol DV that refers to a footnote at the bottom of the Nutrition Facts table. There is a thin rule below the blank cell with no information and under each Amount and percent symbol DV subheadings that spans the width of each column. Note: it is not a continuous line; there is a space in the line between each of the columns.
Left justified on the next line is Fat, in bold followed in columns 2, 3 and 4 by placeholders for the amount and percent Daily Value of fat. Each amount placeholder is followed by a lowercase g and each percent daily value is followed by a percent symbol. Indented on the next line is Saturated followed, in columns 2, 3 and 4 by placeholders for the amount of saturated fat followed by a lowercase g. Indented on the next line there is a plus symbol followed by Trans, followed in columns 2, 3 and 4 by placeholders for the amount of trans followed by a lowercase g. There are also placeholders, in columns 2, 3 and 4 for the combined percent Daily Value for saturated and trans fat which is right justified and vertically centred against saturated and trans information on the left. These are followed by a percent symbol. There is a thin rule below the trans information that spans the width of each column. Note: it is not a continuous line; there is a space in the line between each of the columns.
The next line is Carbohydrate in bold followed in columns 2, 3 and 4 by placeholders for the amount of carbohydrate followed by a lowercase g. Indented on the next line is Fibre followed, in columns 2, 3 and 4, by placeholders for the amount and percent Daily Value of fibre. Each amount placeholder is followed by a lowercase g and each percent daily value is followed by a percent symbol. Indented on the next line is Sugars followed, in columns 2, 3, and 4, by placeholders for the amount and percent Daily Value of sugars. Each amount placeholder is followed by a lowercase g and each percent daily value is followed by a percent symbol. There is a thin rule below the sugars information that spans the width of each column. Note: it is not a continuous line; there is a space in the line between each of the columns.
The next line is Protein in bold followed, in columns 2, 3 and 4, by placeholders for the amount of protein followed by a lowercase g. There is a thin rule below the protein information that spans the width of each column. Note: it is not a continuous line; there is a space in the line between each of the columns.
The next line is Cholesterol in bold followed, in columns 2, 3 and 4, by placeholders for the amount of cholesterol followed by mg in lowercase. There is a thin rule below the cholesterol information that spans the width of each column. Note: it is not a continuous line; there is a space in the line between each of the columns.
The next line is Sodium in bold followed, in columns 2, 3 and 4, by placeholders for the amount and percent Daily Value of sodium. Each amount placeholder is followed by mg in lowercase and each percent daily value is followed by a percent symbol. There is a thick rule below the sodium information that spans the width of each column. Note: it is not a continuous line; there is a space in the line between each of the columns.
The next line is Potassium followed, in columns 2, 3, and 4, by placeholders for the amount and percent Daily Value of potassium. Each amount placeholder is followed by mg in lowercase and each percent daily value is followed by a percent symbol. There is a thin rule below the potassium information that spans the width of each column. Note: it is not a continuous line; there is a space in the line between each of the columns.
The next line is Calcium followed, in columns 2, 3, and 4, by placeholders for the amount and percent Daily Value of calcium. Each amount placeholder is followed by mg in lowercase and each percent daily value is followed by a percent symbol. There is a thin rule below the calcium information that spans the width of each column. Note: it is not a continuous line; there is a space in the line between each of the columns.
The next line is Iron followed, in columns 2, 3 and 4, by placeholders for the amount and percent Daily Value of iron. Each amount placeholder is followed by mg in lowercase and each percent daily value is followed by a percent symbol. There is a thick rule below the iron information that spans the width of the table.
The next line is the percent Daily Value legend and footnote that was referred to at the beginning of the table description. The line starts with an asterisk followed by the letters DV equal sign Daily Value. Right justified on the same line is another asterisk followed by 5 percent symbol or less is a little, 15 percent symbol or more is a lot. The terms 'a little' and 'a lot' are in bold. This is the end of the Nutrition Facts table.
- Vertical display of nutrition information
- Unilingual French and English formats and bilingual format
- Presentation of nutrition information for more than 1 food
- The serving sizes are expressed in a household measure (first) and in a metric measure (second, in brackets)
- Complete nutrient information is given for 2 or more foods [absolute values (g, mg) and where required, % Daily Value (DV)]
- Core information is declared (Calories and 12 nutrients)
- Additional information may be declared
- All nutrition information provided for the first food must also be provided for all food(s) in the same units
- % DV interpretive statement is included in all versions of the aggregate format – different kinds of food
Note: Although the Directory of Nutrition Facts Table Formats and the Compendium of templates: Nutrition Facts tables and list of ingredients do not specify this, Health Canada permits the use of more than 1 household measure in the aggregate format – different kinds of food for prepackaged products containing an assortment of foods of the same type, where:
- a serving consists of only 1 of the foods
- the information for serving size, energy and core nutrients is different for each variety, and
- the household measure of each variety differs
In this case, the household measure for each can appear before the corresponding metric measure of that variety as shown in the image below. The serving size used must reflect the regulated reference amount for the product category in the Table of Reference Amounts for Food.
An example is a variety pack of sliced ready to eat meats, where the thickness of the slice of each variety differs.
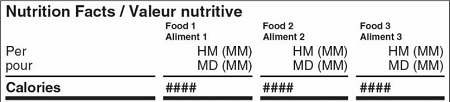
Description – Acceptable serving size declaration in the aggregate format – different kinds of food
The table is divided into 4 columns. Left justified at the top of the first column and spanning into the second column is the heading Nutrition Facts, forward slash, Valeur nutritive in bold. On the next line and at the top of columns 2, 3 and 4 are the subheadings Food 1, Food 2 and Food 3. Stacked directly below are the French subheadings, Aliment 1, Aliment 2 and Aliment 3. These are placeholders for the different name or flavour variations of the food. Below the Nutrition Facts heading, in the first column, is Per and stacked below is pour. On the same line under the subheadings Aliment 1, Aliment 2 and Aliment 3 in columns 2, 3 and 4 and right justified are the subheadings HM open parenthesis MM close parenthesis and stacked below each of these subheadings is MD open parenthesis MM close parenthesis. There is a rule below the pour and MD and MM in parentheses subheadings that spans the width of each column. Note: it is not a continuous line; there is a space in the line between each of the columns.
Below pour is Calories, in bold, followed by placeholders, also in bold, for the amount of Calories per serving of the product in columns 2, 3 and 4. There is a thick rule under Calories and the placeholders that spans the width of each column. Note, it is not a continuous line; there is a space in the line between each of the columns.
Simplified aggregate format
Although not mentioned in the FDR, Health Canada permits the use of a simplified aggregate format – different kinds of foods for prepackaged foods that meet the criteria for both the aggregate format – different kinds of foods (prepackaged foods containing an assortment of foods or separately packaged ingredients) and the simplified format (foods whose nutrient value is "0", as reported in the NFt, for 6 or more of Calories and core nutrients).
Dual format – different amounts of food [B.01.458, FDR]
Purpose: The Dual format – different amounts of food may be used whenever it is suitable to provide nutrition information for a food in more than 1 amount. For instance, foods may have different uses and be consumed in different amounts, or be shown in different units of measurement.
The table Which Nutrition Facts table format family should I use provides guidance on when this format is appropriate for use.
For example, the dual format – different amounts of food may be used to provide information for 2 slices and 1 slice of bread, or for 1/2 cup (125 mL) of applesauce, when served as a fruit, and 1 tbsp (15 mL) of applesauce, when used as a condiment.
The primary serving (HM1) is always reflective of the reference amount.
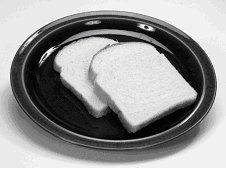
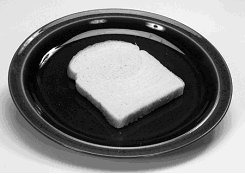
Since the reference amount is reflective of 2 slices of bread, the nutrition information required in the first column of the NFt must be for 2 slices of bread, this being the primary serving (HM1).
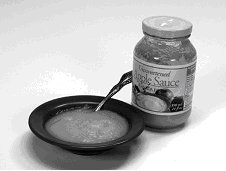
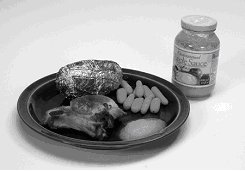
Since 125 mL is the reference amount for applesauce, this amount must be shown as the primary serving within the NFt.
Dual format – different amounts of food: hierarchy of formats decision tree
Click on image for larger view
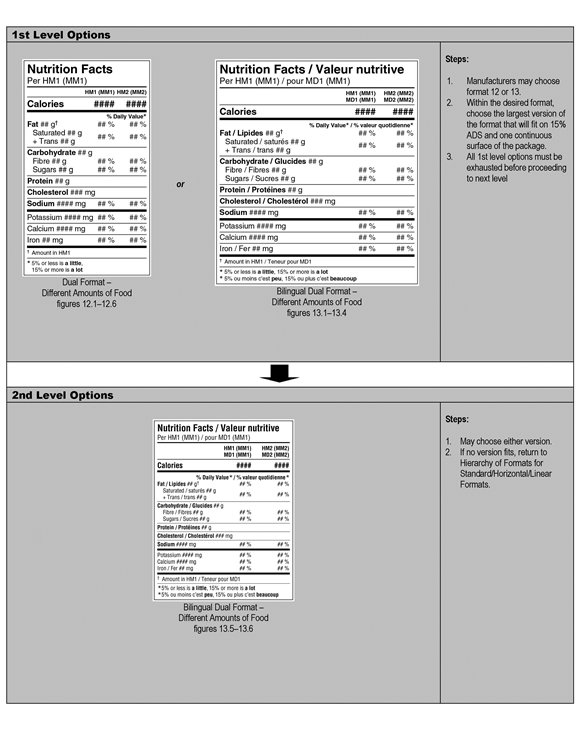
Description – Dual format – different amounts of food: hierarchy of formats decision tree
First level options: Steps for choosing between the dual formats
- Manufacturer may choose format 12 or 13. Dual format (figures 12.1 to 12.6) or bilingual dual format (figures 13.1 to 13.4).
- Within the desired format, choose the largest version of format that will fit on 15% ADS and one continuous surface of the package.
- All first level options must be exhausted before proceeding to next level.
Second level options: Steps for choosing a format when first level options are exhausted
- May choose either version of bilingual dual format (figures 13.5 to 13.6).
- If no version fits, return to hierarchy of format for standard/horizontal/linear formats.
Dual format
Major distinguishing features of the dual format – different amounts of food
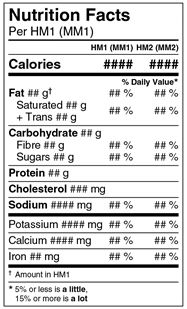
Description – Dual format – different amounts of food – Figure 12.1
Left justified at the top of the table is the heading Nutrition Facts in bold. On the next line is Per HM1, followed by open parenthesis MM1 close parenthesis. There is a rule below the serving of stated size information that spans the width of the table.
In the next line below there is a blank cell with no information. Right justified on the same line are subheadings for 2 columns of information. There is a note outside the table with an arrow pointing to the subheading line which says: Subheadings specify the different amounts of the food for which information is provided. The first subheading is, HM1 open parenthesis MM1 close parenthesis and the second is, HM2 open parenthesis MM2 close parenthesis. These are in bold. There is a thin rule under the blank cell and the subheadings which spans the width of the table.
Left justified on the next line within the table is Calories, in bold, followed by a set of placeholders, also in bold, for the amount of Calories per HM1 and HM2. There is a thick rule under the Calories information that spans the width of the table. Under the thick rule and right justified on the next line is the subheading percent symbol Daily Value, in bold, followed by an asterisk which refers to a footnote at the bottom of the Nutrition Facts table.
Left justified on the next line is Fat, in bold, followed by a placeholder for the amount of fat followed by a lowercase g. The lowercase g follows with a dagger symbol. This refers to a footnote at the bottom of the table. Right justified on the same line are placeholders for the percent Daily Value of fat per HM1 and HM2. The placeholders are followed by percent symbols. Indented on the next line is Saturated and a placeholder for the amount of saturated fat followed by a lowercase g. Indented on the next line, there is a plus symbol followed by Trans followed by a placeholder for the amount of trans followed by a lowercase g. There is a placeholder for the combined percent Daily Value for saturated and trans fat per HM1 and HM2, which is right justified and vertically centred against saturated and trans information on the left. There is a thin rule below the trans information that spans the width of the table.
The next line is Carbohydrate, in bold, followed by a placeholder for the amount of carbohydrate followed by lowercase g. Indented on the next lineis Fibre and a placeholder for the amount of Fibre followed by a lowercase g. Right justified on the same line are placeholders for the percent Daily Value of fibre per HM1 and HM2. The placeholders are followed by percent symbols. Indented on the next line is Sugars and a placeholder for the amount of sugars followed by a lowercase g. Right justified on the same line are placeholders for the percent Daily Value of sugars per HM1 and HM2. The placeholders are followed by percent symbols. There is a thin rule under the sugars information that spans the width of the table.
The next line is Protein, in bold, followed by a placeholder for the amount of protein followed by a lowercase g. There is a thin rule under the protein information that spans the width of the table.
The next line is Cholesterol, in bold, followed by a placeholder for the amount of cholesterol followed by mg in lowercase. There is a thin rule under the cholesterol information that spans the width of the table.
The next line is Sodium, in bold, followed by a placeholder for the amount of sodium followed by mg in lowercase. Right justified on the same line are placeholders for the percent Daily Value of sodium per HM1 and HM2. The placeholders are followed by percent symbols. There is a thick rule under the sodium information that spans the width of the table.
The next line is Potassium followed by a placeholder for the amount of potassium followed by mg in lowercase. Right justified on the same line are placeholders for the percent Daily Value of potassium per HM1 and HM2. The placeholders are followed by percent symbols. There is a thin rule under the potassium information that spans the width of the table.
The next line is Calcium followed by a placeholder for the amount of calcium followed by mg in lowercase. Right justified on the same line are placeholders for the percent Daily Value of calcium per HM1 and HM2. The placeholders are followed by percent symbols. There is a thin rule below the calcium information that spans the width of the table.
The next line is Iron followed by a placeholder for the amount of iron followed by mg in lowercase. Right justified on the same line are placeholders for the percent Daily Value of iron per HM1 and HM2. The placeholders are followed by percent symbols. There is a thick rule under the iron information that spans the width of the Nutrition Facts table.
The next line is the dagger symbol footnote that was referred to earlier in the table description. It starts with the dagger symbol followed by Amount in HM1. There is a thin rule under this footnote that spans the width of the Nutrition Facts table. Below this line and left justified is the percent Daily Value footnote. It starts with an asterisk followed by the statement: 5 percent symbol or less is a little. On the next line, the footnote continues with: 15 percent symbol or more is a lot. The terms 'a little' and 'a lot' are in bold. This is the end of the Nutrition Facts table.
Nutrition Facts table
- Vertical display of nutrition information
- Unilingual French and English formats and bilingual format
Serving size and sub-headings
- There is 1 serving size declaration for the primary serving of food, declared as a household measure (first) and in a metric measure (second, in brackets). The primary serving corresponds to the serving of food declared below the Nutrition Facts heading and is reflective of the reference amount
- Sub-headings: Declare the different amounts of food in a household measure (first) and in a metric measure (second, in brackets)
Nutrient declarations
- First amount of food (that is, the primary serving):
- Complete nutrition information [absolute values (g, mg) and where required, % Daily Value (DV)] are provided for the first amount of food
- Core information is declared (Calories and 12 nutrients)
- Additional information may be declared
- For other amounts of food:
- Calories
- % DV for any nutrient that is declared as a % DV for the first amount of food
Footnote
- % DV interpretative statement is included in all versions of the dual format – different amounts of food
Aggregate format – different amounts of food [B.01.459, FDR]
Purpose: Similarly to the dual format – different amounts of food, the aggregate format – different amounts of food may be used whenever it is suitable to provide nutrition information for a food in more than 1 amount, to reflect different uses or different units of measurement of a food.
The aggregate format – different amounts of food provides complete nutrition information (that is, in both absolute values and % Daily Values) for all amounts of food, whereas the dual format – different amounts of food only provides absolute values for the first amount of food.
The table Which Nutrition Facts table format family should I use provides guidance on when this format is appropriate for use.
For example, the aggregate format – different amounts of food may be used to provide information for 2 slices and 1 slice of bread, or for 1 tbsp (15 mL) of condensed milk, when used to whiten coffee, or 1/2 cup (125 mL), when reconstituted and used as a beverage.
The primary serving (HM1) is always reflective of the reference amount.
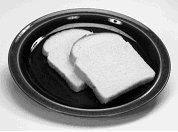


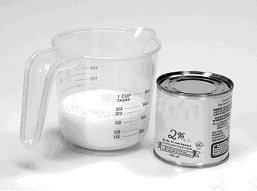
Aggregate format – different amounts of food: hierarchy of formats decision tree
Click on image for larger view
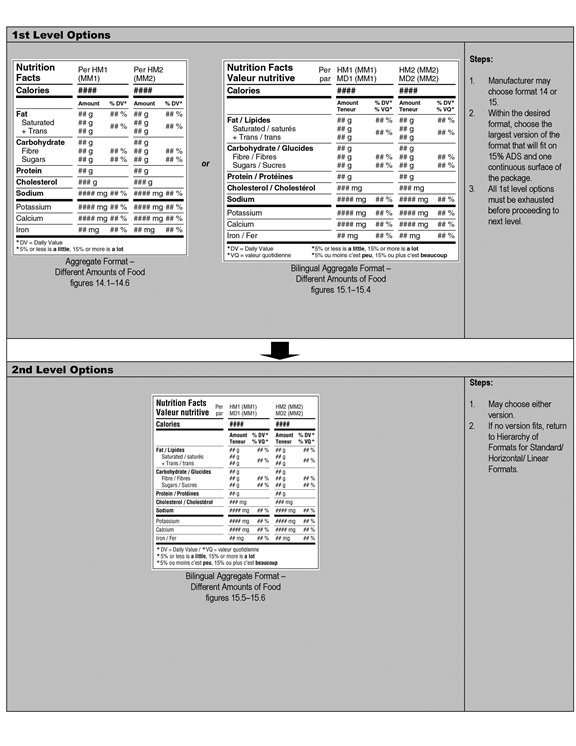
Description – Aggregate format – different amounts of food – Hierarchy of formats/decision tree
First level options: Steps for choosing between the dual formats
- Manufacturer may choose format 14 or 15. Aggregate format (figures 14.1 to 14.6) or bilingual aggregate format (figures 15.1 to 15.4).
- Within the desired format, choose the largest version of format that will fit on 15% ADS and one continuous surface of the package.
- All first level options must be exhausted before proceeding to next level.
Second level options: Steps for choosing a format when first level options are exhausted
- May choose either version of bilingual aggregate format (figures 15.5 to 15.6).
- If no version fits, return to hierarchy of format for standard/horizontal/linear formats.
Aggregate format
Major distinguishing features of the aggregate format – different amounts of food
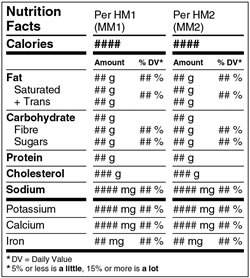
Description – Aggregate format – different amounts of food – Figure 14.1
The table is divided into 3 columns. Left justified at the top of the first column is the heading Nutrition Facts in bold. The word Nutrition is on the first line with the word Facts stacked directly underneath. At the top of the second column and left justified is Per HM1 and stacked directly below it and on the same line as the word Facts is MM1 in parentheses. At the top of the third column and left justified is Per HM2 and stacked directly below it and on the same line as the word Facts and MM1, in parentheses, is MM2 in parentheses. There is a rule below the word Facts, MM1 in parentheses and MM2 in parentheses that spans the width of each column. Note it is not a continuous line; there is a space between each of the columns.
Below the word Facts and under the rule is Calories, in bold, followed by placeholders, also in bold, for the amount of Calories per HM1 and HM2 in columns 2 and 3. There is a thick rule under Calories and the placeholders that spans the width of each column. Note, it is not a continuous line; there is a space in the line between each of the columns.
On the next line down under the Calories information there is a blank cell with no information. In the same line under the amount of Calories placeholders in columns 2 and 3 are the subheadings Amount and Percent symbol DV in bold. There is an asterisk after each percent DV that refers to a footnote at the bottom of the Nutrition Facts table. There is a thin rule below the blank cell with no information and under each Amount and percent DV subheading that spans the width of each column. Note: it is not a continuous line; there is a space in the line between each of the columns.
Left justified on the next line is Fat in bold followed, in columns 2 and 3 by placeholders for the amount and percent Daily Value of fat. Each amount placeholder is followed by a lowercase g and each percent daily value is followed by a percent symbol. Indented on the next line is Saturated followed, in columns 2 and 3 by placeholders for the amount of saturated fat followed by a lowercase g. Indented on the next line there is a plus symbol followed by Trans followed, in columns 2 and 3 by placeholders for the amount of trans followed by a lowercase g. There are also placeholders, in columns 2 and 3 for the combined percent Daily Value for saturated and trans fat which is right justified and centered against saturated and trans information on the left. These are followed by a percent symbol. There is a thin rule below the trans information that spans the width of each column. Note: it is not a continuous line; there is a space in the line between each of the columns.
The next line is Carbohydrate in bold followed, in columns 2 and 3 by placeholders for the amount of carbohydrate followed by a lowercase g. Indented on the next line is Fibre followed, in columns 2 and 3 by placeholders for the amount and percent Daily Value of fibre followed by a lowercase g and each percent daily value is followed by a percent symbol. Indented on the next line is Sugars followed, in columns 2 and 3 by placeholders for the amount and percent Daily Value of sugars. Each amount placeholder is followed by a lowercase g and each percent daily value is followed by a percent symbol. There is a thin rule below the sugars information that spans the width of each column. Note: it is not a continuous line; there is a space in the line between each of the columns.
The next line is Protein in bold followed, in columns 2 and 3 by placeholders for the amount of protein followed by a lowercase g. There is a thin rule below the protein information that spans the width of each column. Note: it is not a continuous line; there is a space in the line between each of the columns.
The next line is Cholesterol in bold followed, in columns 2 and 3 by placeholders for the amount of cholesterol followed by mg in lowercase. There is a thin rule below the cholesterol information that spans the width of each column. Note: it is not a continuous line; there is a space in the line between each of the columns.
The next line is Sodium in bold followed, in columns 2 and 3 by placeholders for the amount and percent Daily Value of sodium. Each amount placeholder is followed by mg in lowercase and each percent daily value is followed by a percent symbol. There is a thick rule below the sodium information that spans the width of each column. Note: it is not a continuous line; there is a space in the line between each of the columns.
The next line is Potassium followed, in columns 2 and 3 by placeholders for the amount and percent Daily Value of potassium. Each amount placeholder is followed by mg in lowercase and each percent daily value is followed by a percent symbol. There is a thin rule below the potassium information that spans the width of each column. Note: it is not a continuous line; there is a space in the line between each of the columns.
The next line is Calcium followed, in columns 2 and 3 by placeholders for the amount and percent Daily Value of calcium. Each amount placeholder is followed by mg in lowercase and each percent daily value is followed by a percent symbol. There is a thin rule below the calcium information that spans the width of each column. Note: it is not a continuous line; there is a space in the line between each of the columns.
The next line is Iron followed, in columns 2 and 3 by placeholders for the amount and percent Daily Value of iron. Each amount placeholder is followed by mg in lowercase and each percent daily value is followed by a percent symbol. There is a thick rule below the iron information that spans the width of the table.
The next line is the percent Daily Value footnote that was referred to at the beginning of the table description. The footnote starts with an asterisk followed by the letters DV equal sign Daily Value. The next line the footnote continues with: 5 percent symbol or less is a little, 15 percent symbol or more is a lot. The terms 'a little' and 'a lot' are in bold. This is the end of the Nutrition Facts table.
Nutrition Facts table
- Presentation of nutrition information for more than 1 serving size of a food
- Unilingual English and French tables and bilingual table
Serving size and headings
- The serving size for all amounts of foods appear as headings to the appropriate columns of information
- The serving size for all amounts of food is expressed as a household measure (first) and in a metric measure (second, in brackets)
- The primary serving corresponds to the first serving of food and is reflective of the reference amount
Nutrient declarations
- Complete nutrient information is given for all amounts of food [absolute values (g, mg) and where required, % Daily Value (DV)]
- Core information is declared (Calories and 12 nutrients)
- Additional information may be declared
- All nutrition information provided for the first amount of food must also be provided for all amount(s) in the same units
Footnote
- % DV interpretative statement is included in all versions of the aggregate format – different amounts of food
Alternate methods of presentation
The FDR provides for alternatives in the presentation of nutrition information. For many of the formats, but not all formats, prepackaged products that meet the conditions of being able to use a third level Nutrition Facts table (NFt) option may use "Alternative methods of presentation".
When the FDR permits these alternative methods, the NFt may be set out on:
- a tag attached to the package
- package insert
- the inner side of a label
- a fold-out label, or
- an outer sleeve, overwrap or collar
Any version (size) of the permitted NFt formats may be used. In the case of a package insert or the inner side of a label, the outer label of the prepackaged product shall indicate in a type size of not less than 8 points where the Nutrition Facts table is located [B.01.466, FDR].
Nutrition Facts table formats on tags
The available display surface for tags section provides information for situations in which a Nutrition Facts table (NFt) may alternatively be presented on a tag attached to a package.
When the NFt is set out on a tag, it must be set out in a format and size described in 1 of the following sections of the FDR:
- B.01.454(6) standard and horizontal formats
- B.01.455(5) simplified formats
- B.01.455.1(5) simplified formats – single-serving prepackaged products
- B.01.456(4) dual format – foods requiring preparation
- B.01.457(4) aggregate format – different kinds of foods
- B.01.458(4) dual format – different amounts of food, or
- B.01.459(4) aggregate format – different amounts of food
Formats for specific packaging cases
Small packages < 100 cm2 available display surface
Small packages with an available display surface (ADS) of <100 cm2 need not carry a Nutrition Facts table (NFt) on the label provided that an indication is present on the outer label indicating how the consumer or purchaser may obtain the nutrition information [B.01.467(1), FDR]. There are several requirements which the statement must meet. Refer to the Manner of declaring the statement section for more information.
Losing the < 100 cm2 ADS exemption
There are several scenarios in which this small package NFt exemption does not apply and the package is required to carry an NFt [B.01.467(2), FDR]. These scenarios are covered in Reasons for losing the nutrition labelling exemption, with 1 exception: ground meat, ground meat by-products, ground poultry meat and ground poultry meat by-products may still retain this small package NFt exemption.
When the exemption is lost, the NFt need only include:
- the serving size
- Calories and any of the core nutrients that cannot be expressed as "0"
- any nutrient that is the subject of a representation, and
- any sugar alcohol, vitamin or mineral nutrient that is added to the product [B.01.468(1), FDR]
Alternate methods of presentation (for example, tag, package insert, inner label, a fold-out label, an outer sleeve, overwrap or collar) may be used. However, the format hierarchy must permit that option.
Note: Exemptions from bilingual labelling exist for local foods, test market foods and specialty foods [B.01.012(3) and (7), FDR].
Never losing the < 100 cm2 ADS exemption
The NFt exemption for small packages with an ADS of < 100 cm2 also applies to a prepackaged product that qualifies for a free of sugars claim, when the following conditions are met [B.01.467(2.1), FDR]:
- the product does not contain an added vitamin or mineral nutrient
- the Calories and the amount of sugar alcohols are shown immediately after whichever of the following elements appears last on the label:
- the list of ingredients
- a phenylalanine statement
- a contains statement
- a cross-contamination statement
- the free of sugars claim or the common name that includes the term "sugar-free" must be legibly set out on the principal display panel:
- in lower case letters, except the first letter of each word in the statement or claim which may be in upper case
- in a type size no less than that of the numerical quantity in the declaration of net quantity, and
- with sufficient contrast between the text and the background
Manner of declaring the statement
The statement indicating how the nutrition information may be obtained must satisfy several requirements [B.01.467(3), FDR]:
- the print type size of the statement must not be less than 8 points
- the statement must include a postal address or a toll-free telephone number, and
- the statement must be declared in both French and English
The manufacturer of the prepackaged product must provide nutrition information upon request [B.01.467(4), FDR]:
- without charge, and
- in French or English, or both languages as requested
The manufacturer must also ensure that:
- the Nutrition Facts table is in a format that would otherwise be used on the label in accordance with the regulations (as specified in sections B.01.454 to B.01.459 and B.01.461 to B.01.464 of the FDR). For example, a standard format is suitable to provide nutrition information based on one serving of food as sold
- horizontal or linear formats are not used
- the largest version (size) of an appropriate format listed in the top level of the decision trees is used (for example, figures 1.1, 2.1, 3.1), and
- the Nutrition Facts table conforms to all requirements of the regulations (for example, content, format)
Retail packages ≥ 200 cm2 available display surface
A product sold only in the retail establishment where it is packaged, when the package has an available display surface (ADS) of 200 cm2 or more and is labelled with a sticker, is not exempt from declaring an NFt.
- For products using standard formats (that is, providing nutrition information for 1 serving of food as sold), 1 of the following Nutrition Facts tables must be used: standard (figures 1.1 to 1.3), narrow standard (figures 2.1 to 2.3) or the bilingual standard (figures 3.1 to 3.3) [B.01.454(5), FDR]
- When products qualify to use simplified formats (products that may declare "0" for 6 or more of Calories and core nutrients), the retailer has the option of using 1 of the following Nutrition Facts tables: simplified standard (figures 5.1 to 5.3) or the bilingual simplified standard (figures 6.1 to 6.3) [B.01.455(4), FDR]
- For single-serving prepackaged products, other than prepackaged meals, using the simplified format – single-serving prepackaged products, 1 of the following Nutrition Facts tables must be used: bilingual simplified standard (figures 6.1.1 to 6.3.1)
- For products that display an aggregate or dual format, the retailer must choose the version of the applicable format based on the ADS of the package
Reference information
Compendium of templates for Nutrition Facts tables and list of ingredients
To help label designers and the food and packaging industry meet format specifications of the FDR, Health Canada developed a Compendium of templates for Nutrition Facts tables and list of ingredients which is available for order on the Health Canada website. The templates are the actual-size graphic illustrations of the various versions of the Nutrition Facts table permitted by the FDR. Also included are a few sample templates for the list of ingredients that would meet the graphic specifications as set out in the FDR.
The templates were created in Adobe InDesign CC 2015 and are available in INDD, IDML and PDF format. The IND files can be opened and edited in Adobe InDesign CC 2015 or newer. The IDML files can be opened and edited in older versions of Adobe InDesign (CS4 and later).
It is recommended that the templates be edited in Adobe InDesign, however conversion to other software packages is possible. A third-party extension (for example, ID2Q by Markzware) can be used to convert the InDesign files to Quark Xpress files.
If the Acrobat (PDF) files are viewed or printed using Acrobat Reader or opened in commonly used artwork software packages such as Adobe Illustrator or Macromedia Freehand, the conversion may not be perfect and will cause alterations in the graphic elements. Consequently, before using the converted templates, it is important to check them against the graphic specifications in the Nutrition Labelling – Directory of Nutrition Facts Table Formats document posted on the Health Canada website which sets out all measurements for the NFTs.
The templates in the Compendium of templates for Nutrition Facts tables and list of ingredients only contain mandatory information. If additional information is included in the NFt, it will not fit in the templates without altering the measurements. The outer measurements of the NFt, as listed on the templates, may change if additional information is declared or if fonts other than Helvetica or Arial are used.
The FDR set the graphic and technical requirements for how nutrition information must be displayed in the NFt [B.01.450, B.01.460, FDR, and Nutrition Labelling – Directory of Nutrition Facts Table Formats]. This covers aspects such as order of presentation, dimensions, spacing and the use of upper and lower case letters and bold type. For more details, refer to Presentation of the Nutrition Facts table page.
- Date modified: