
ISSN: 2819-0270
On this page
- 1. Introduction
- 2. Highlights of fiscal quarter and fiscal year-to-date (YTD) Result
- 3. Risks and uncertainties
- 4. Significant changes in relation to operations, personnel and programs
- Annex A – Statement of authorities (unaudited)
- Annex B – Departmental budgetary expenditures by standard object (unaudited)
1. Introduction
This quarterly report (Q1) has been prepared by management as required by section 65.1 of the Financial Administration Act and in the form and manner prescribed by the Treasury Board. This quarterly report should be read in conjunction with the 2026 to 2027 Main Estimates, the 2026 to 2027 Supplementary Estimates and authorities received from Treasury Board central votes. Main and Supplementary Estimates documents can be found on the Government of Canada's Planned government spending webpage.
A summary description of the program activities of the Canadian Food Inspection Agency (CFIA) can be found in the CFIA's 2026 to 2027 Departmental Plan.
This quarterly report has not been subject to an external audit or review.
1.1 CFIA mandate
The Minister of Health is responsible for the CFIA and for the overall direction of the Agency. In addition, the Minister of Agriculture and Agri-Food is responsible for oversight of the Agency's non-food safety agricultural activities, including economic and trade issues, as well as important animal health and plant protection work.
The CFIA is headed by a President, who has the rank and all the powers of a Deputy Head of a Department. The President is also the Chief Executive Officer. The responsibilities of these roles are outlined in the Canadian Food Inspection Agency Act 1997, c.6.
On June 18, 2026, Bill C-30, an Act to implement certain provisions of the spring economic update, received Royal Assent. This Act amended the CFIA Act to introduce an explicit mandate section. This mandate clarifies that, alongside its core responsibility to protect health and safety, the CFIA should also consider broader economic and food security impacts in carrying out its mandate.
Mitigating risks to food safety, and animal and plant health is the CFIA's highest priority, and the health and safety of Canadians is the driving force behind the design and development of CFIA programs. The CFIA, in collaboration with industry, consumers, Indigenous partners, and federal, provincial, and municipal organizations, continues to work towards protecting Canadians and the environment from preventable health risks related to food safety, and plant and zoonotic diseases.
In collaboration with its partners in Canada and abroad, the CFIA is applying a One Health approach to many issues encompassed by its mandate. The One Health approach recognizes the interconnectedness of the health of humans, animals, plants, and the environment and that efforts to address serious global health issues benefit from strong coordination and collaboration between professionals in these fields. The One Health approach also benefits from shared resources and investments.
1.2 Basis of presentation
This quarterly report has been prepared by management using an expenditure basis of accounting. The accompanying Statement of Authorities (Annex A) includes the Agency's spending authorities granted by Parliament and those used by the Agency, consistent with the supplies granted for the 2026 to 2027 Main Estimates, the 2026 to 2027 Supplementary Estimates and authorities received from Treasury Board central votes. This quarterly report has been prepared using a special purpose financial reporting framework designed to meet financial information needs with respect to the use of spending authorities.
The authority of Parliament is required before funding can be spent by the Government. Approvals are given through annual appropriation acts or legislation which provides statutory spending authority for specific purposes. The CFIA was granted its full supply for the 2026 to 2027 fiscal year in June 2026.
The Agency uses the full accrual method of accounting to prepare and present its annual financial statements that are part of the departmental results reporting process. However, the spending authorities voted by Parliament remain on an expenditure basis.
2. Highlights of fiscal quarter and fiscal year-to-date (YTD) result
In line with previously reported variances in the Departmental Results Report and Quarterly Financial Reports, the CFIA has determined that variances which are greater than $5.0 million and represent more than a 10% change, in budget or expenditures from one year to the next, are deemed significant. When both criteria are met, further analysis is always provided. Further analysis is also provided when the dollar value is deemed significant.
The following graph provides a comparison of total budgetary authorities available for spending and year-to-date expenditures for the first quarter of the current and previous fiscal years.
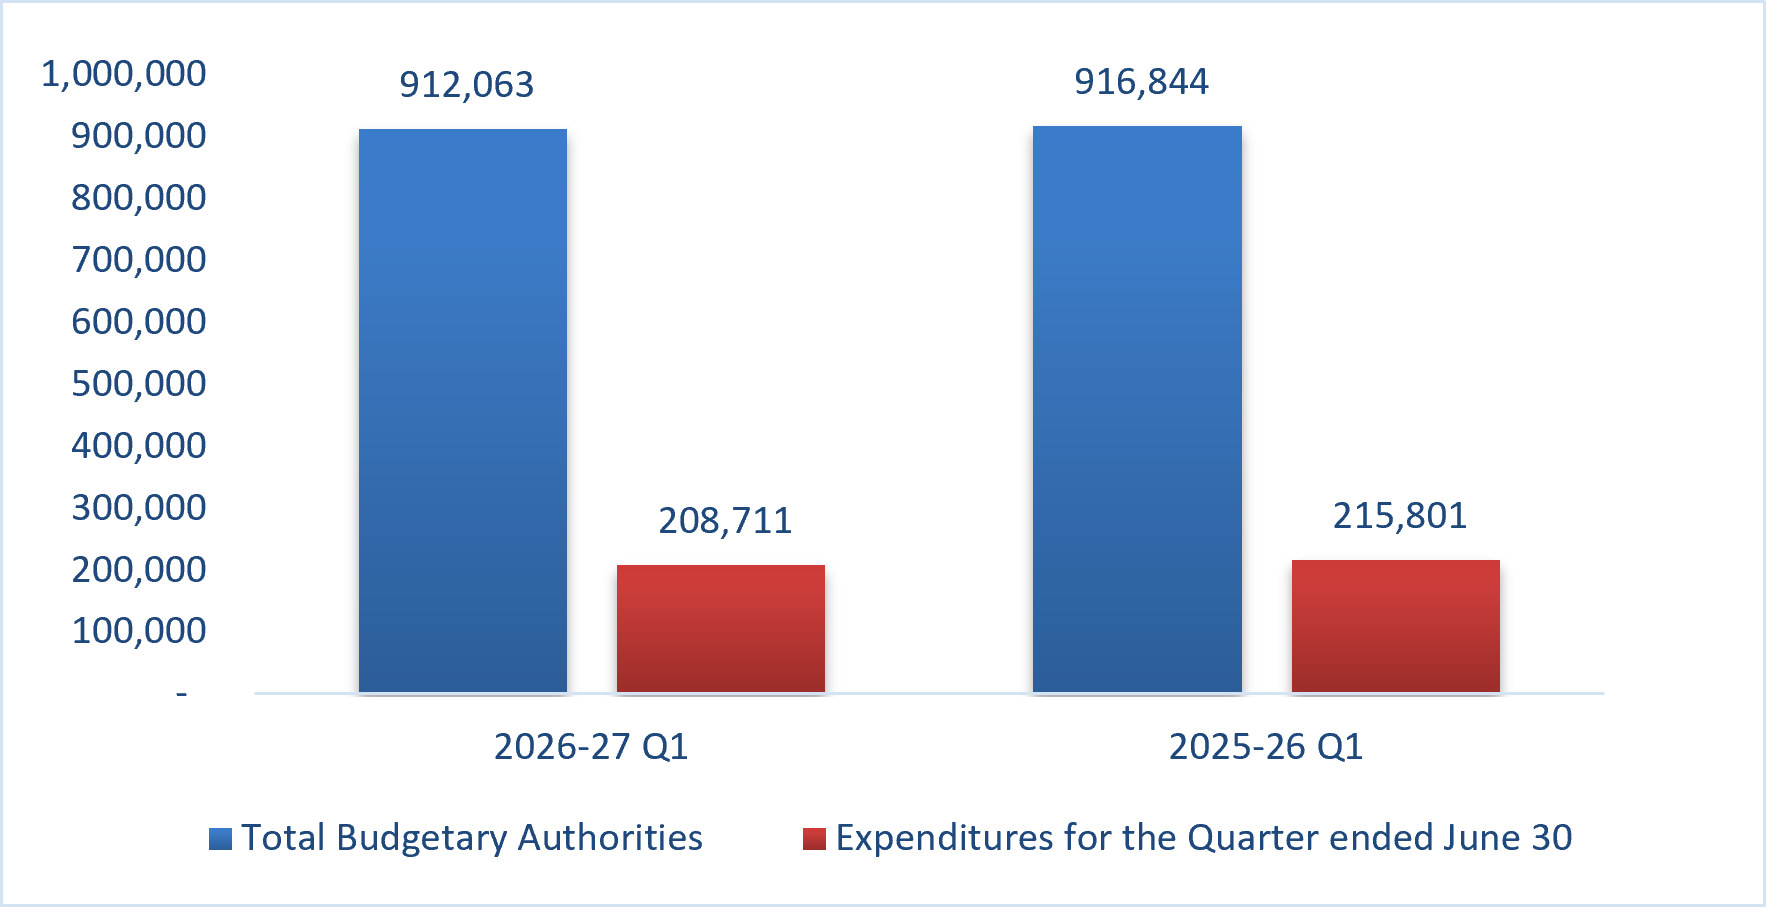
Graph 1. Comparison of total budgetary authorities and expenditures for the quarter ended June 30 for fiscal years 2026 to 2027 and 2025 to 2026 (in thousands of dollars) – Text version
| Quarter ended June 30 | 2026 to 2027 | 2025 to 2026 |
|---|---|---|
| Total budgetary authorities | 912,063 | 916,844 |
| Expenditures for the quarter ended June 30 | 208,711 | 215,801 |
2.1 Significant changes to budgetary authorities
At the end of the first quarter, June 30, 2026 (Q1), the CFIA had $912.1 million of authorities available for spending, as detailed in Table 1. This represents an overall decrease of $4.8 million (-0.5%) compared to the end of the same quarter in 2025 to 2026. Below is a breakdown of the variance.
| Authorities | 2026 to 2027 | 2025 to 2026 | Variances | % |
|---|---|---|---|---|
| Vote 1 – Operating expenditures, grants, and contributions | 718,893 | 735,988 | -17,095 | -2.3 |
| Vote 5 – Capital expenditures | 22,913 | 19,777 | 3,136 | 15.9 |
| Budgetary statutory authorities | ||||
| Employee benefit plans | 104,757 | 95,579 | 9,178 | 9.6 |
| Compensation payments | 12,500 | 12,500 | 0 | 0.0 |
| Spending of revenues / Other | 53,000 | 53,000 | 0 | 0.0 |
| Total authorities | 912,063 | 916,844 | -4,781 | -0.5 |
Numbers may not add due to rounding.
The Vote 1 - Operating expenditures and grant and contributions authorities decreased by $17.1 million (-2.3%) attributed to the net effect of the following items:
- An increase of $11.3 million for funding to support Canada's trade diversification.
- An increase of $4.8 million in Collective Bargaining Agreement settlements.
These increases have been partially offset by:
- A decrease of $11.5 million for the sunsetting of funding for Keeping Food Safe (KFS) for Canadian.
- A decrease of $6.4 million for Refocusing Government Spending reduction (Budget 2023).
- A decrease of $5.1 million for sunsetting of funding related to African swine fever (ASF).
- A decrease of $4.8 million for sunsetting of funding related to the Canadian shellfish sanitation program (CSSP).
- A decrease of $4.8 million for sunsetting of funding related to pet trade.
The funding for KFS, ASF and CSSP has been renewed. The Agency expects to receive additional funding via the subsequent Supplementary Estimates during the fiscal year.
The Vote 5 – Capital expenditures authorities available for spending increased by $3.1 million (15.9%) mainly due to new funding to support Canada's trade diversification.
Employee Benefit Plan (EBP) – total $9.2 million increase (9.6%) in EBP can be largely explained by a variation in the EBP rate set by the Treasury Board Secretariat.
The fluctuations in authorities available for spending are most notable in the following standard objects (see Annex B for the full listing of budgetary authorities by standard object):
- Professional and special services: a net decrease of $4.3 million (-4.9%) is mainly related to several sunsetting funds such as KFS, ASF, CSSP and pet trade, and partially offset by the funding related to the new Trade Diversification funding.
2.2 Significant changes in year-to-date expenditures
At the end of the first quarter for the 2026 to 2027 fiscal year, the CFIA had expenditures of $208.7 million as outlined in Table 2. This represents an overall decrease of $7.1 million (-3.3%) compared to the end of the same quarter for the 2025 to 2026 fiscal year. Below is a breakdown of the variance.
| Expenditures | 2026 to 2027 | 2025 to 2026 | Variances | % |
|---|---|---|---|---|
| Vote 1 – Operating expenditures, grants, and contributions | 164,550 | 163,989 | 561 | 0.3 |
| Vote 5 – Capital expenditures | 1,675 | 1,875 | -200 | -10.6 |
| Budgetary statutory authorities | ||||
| Employee benefit plans | 24,091 | 23,895 | 196 | 0.8 |
| Compensation payments | 10,530 | 18,147 | -7,617 | -42.0 |
| Spending of revenues / Other | 7,865 | 7,895 | -30 | -0.4 |
| Total authorities | 208,711 | 215,801 | -7,090 | -3.3 |
Numbers may not add due to rounding.
Compared to the same quarter in 2025 to 2026, the decrease in expenditures is mainly due to reduced compensation payments. Compensation payments as at the end of Q1 decreased by $7.6 million (-42%) mainly due to reduced payments for highly pathogenic avian influenza (HPAI). Since compensation payments are statutory in nature, the Agency is within its authority to incur expenditures as required. These authorities will be adjusted at year-end to the equivalent of all expenditures related to compensation payments.
The fluctuations in expenditures are most notable in the following standard objects (see Annex B for the full listing of budgetary expenditures by standard object):
- Transfer Payments: a decrease of $7.6 million (-42.0%) is mainly due to reduced payments for HPAI.
3. Risks and uncertainties
The Agency operates in a dynamic and complex environment impacted by interconnected risks in the global trading environment, climate change, and multiple concurrent emergencies. The Agency has established a dedicated emergency reserve to manage the incremental response costs associated with emergencies. This is reviewed every year as part of the Agency's planning process and is subject to ongoing monitoring.
Global trade, climate change, and associated factors (including environmental degradation, natural disasters, and warming global temperatures) have increased the frequency and scale of serious animal diseases and plant pests worldwide. As a result, the CFIA is increasingly likely to face more frequent and widespread disease outbreaks. Key threats include plant pests like spotted lanternfly and emerald ash borer, and animal diseases like African swine fever and foot and mouth disease. Animal diseases that pose risks to human health include dog rabies and prion diseases such as bovine spongiform encephalopathy. The CFIA also continues to manage a multi-year highly pathogenic avian influenza outbreak affecting poultry, wildlife, and people, with risks of potential interspecies transmission and broader economic and public health impacts. Individually or concurrently, these events could strain the CFIA's capacity to deliver essential services. In response to these risks, the CFIA has advanced its climate change adaptation efforts by implementing targeted measures to strengthen system resilience, while supporting Canada's transition to a sustainable, secure agri-food system.
As the lead authority for safeguarding Canada's food system and plant and animal resources that support the Canadian economy, the Agency must act quickly and beyond normal business operations when these situations arise to safeguard Canadians and maintain access to export markets. Shifts in the global trade environment may pose risks to Canada's economy and its ability to expand market access and support trade, arising from factors such as supply chain disruptions and increased prevalence of animal and plant diseases and plant pests. Responses to these situations could require measures to prevent market disruptions and safeguard trade continuity and the CFIA's ability to maintain critical operations. To navigate shifting global trade dynamics, the CFIA has enhanced international engagement by collaborating with international authorities, and supported market access, helping Canada's agri-food sectors remain resilient and competitive.
4. Significant changes in relation to operations, personnel, and programs
4.1 Operations and programs
Effective April 1, 2026, the Agency has moved to a business-line model focused on Food Safety and Science, Animal Health, and Plant Health, supported by a Policy, Trade and Business Enablement Branch. This structure better aligns accountability with the risks managed by the Agency, and the outcomes Canadians expect from the Agency.
4.2 Personnel
- Diane Allan has been appointed as Vice-President, Animal Health and Emergency Management Branch, effective April 1, 2026
- Debbie Beresford-Green has been appointed as Vice-President, Food Safety and Science Branch, effective April 1, 2026
- Dr. David Nanang has been appointed as Vice-President, Plant Health and Chief Scientist Branch, effective April 1, 2026
Approved by:
Dr. Harpreet S. Kochhar
President, CFIA
Ottawa (Ontario)
Date: August 25, 2026
Stanley Xu, CPA, CGA
Vice-President, Corporate Management Branch and Chief Financial Officer, CFIA
Annex A - Statement of authorities (unaudited)
| - | Fiscal year 2026 to 2027 | Fiscal year 2025 to 2026 | ||||
|---|---|---|---|---|---|---|
| Total available for use for the year ending March 31, 2027Table note 1 | Used during the quarter ended June 30, 2026 | Year to date used at quarter-end | Total available for use for the year ending March 31, 2026Table note 1 | Used during the quarter ended June 30, 2025 | Year to date used at quarter-end | |
| Vote 1 – Operating expenditures, grants, and contributions | 718,893 | 164,550 | 164,550 | 735,988 | 163,989 | 163,989 |
| Vote 5 – Capital expenditures | 22,913 | 1,675 | 1,675 | 19,777 | 1,875 | 1,875 |
| Budgetary statutory authorities | ||||||
| Employee benefit plans | 104,757 | 24,091 | 24,091 | 95,579 | 23,895 | 23,895 |
| Compensation payments | 12,500 | 10,530 | 10,530 | 12,500 | 18,147 | 18,147 |
| Spending of revenues | 53,000 | 7,859 | 7,859 | 53,000 | 7,892 | 7,892 |
| Refunds of previous years revenue | 0 | 6 | 6 | 0 | 3 | 3 |
| Collection agency fees | 0 | 0 | 0 | 0 | 0 | 0 |
| Spending of proceeds from the disposal of surplus Crown assets | 0 | 0 | 0 | 0 | 0 | 0 |
| Total budgetary authority | 912,063 | 208,711 | 208,711 | 916,844 | 215,801 | 215,801 |
Numbers may not add due to rounding.
Annex B – Departmental budgetary expenditures by standard object (unaudited)
| - | Fiscal year 2026 to 2027 | Fiscal year 2025 to 2026 | ||||
|---|---|---|---|---|---|---|
| Total available for use for the year ending March 31, 2027Table note 1 | Used during the quarter ended June 30, 2026 | Year to date used at quarter-end | Total available for use for the year ending March 31, 2026Table note 1 | Used during the quarter ended June 30, 2025 | Year to date used at quarter-end | |
| Expenditures | ||||||
| Personnel | 723,429 | 181,225 | 181,225 | 720,280 | 181,151 | 181,151 |
| Transportation and communications | 9,357 | 1,771 | 1,771 | 10,660 | 1,225 | 1,225 |
| Information | 10,998 | 185 | 185 | 11,993 | 114 | 114 |
| Professional and special services | 82,993 | 6,523 | 6,523 | 87,303 | 7,320 | 7,320 |
| Rentals | 15,016 | 1,713 | 1,713 | 14,958 | 2,168 | 2,168 |
| Repair and maintenance | 11,880 | 1,601 | 1,601 | 11,860 | 1,213 | 1,213 |
| Utilities, materials and supplies | 31,335 | 2,707 | 2,707 | 32,135 | 2,458 | 2,458 |
| Acquisition of land, buildings and works | 0 | 0 | 0 | 0 | 0 | 0 |
| Acquisition of machinery and equipment | 11,338 | 2,371 | 2,371 | 11,938 | 1,773 | 1,773 |
| Transfer payments | 13,100 | 10,530 | 10,530 | 13,100 | 18,147 | 18,147 |
| Public debt charges | 0 | 0 | 0 | 0 | 0 | 0 |
| Other subsidies and payments | 2,617 | 85 | 85 | 2,617 | 232 | 232 |
| Total gross budgetary expenditures | 912,063 | 208,711 | 208,711 | 916,844 | 215,801 | 215,801 |
Numbers may not add due to rounding.